29
/
en
AIzaSyAYiBZKx7MnpbEhh9jyipgxe19OcubqV5w
April 1, 2024
223552
Philippines
PHL
true
2
1
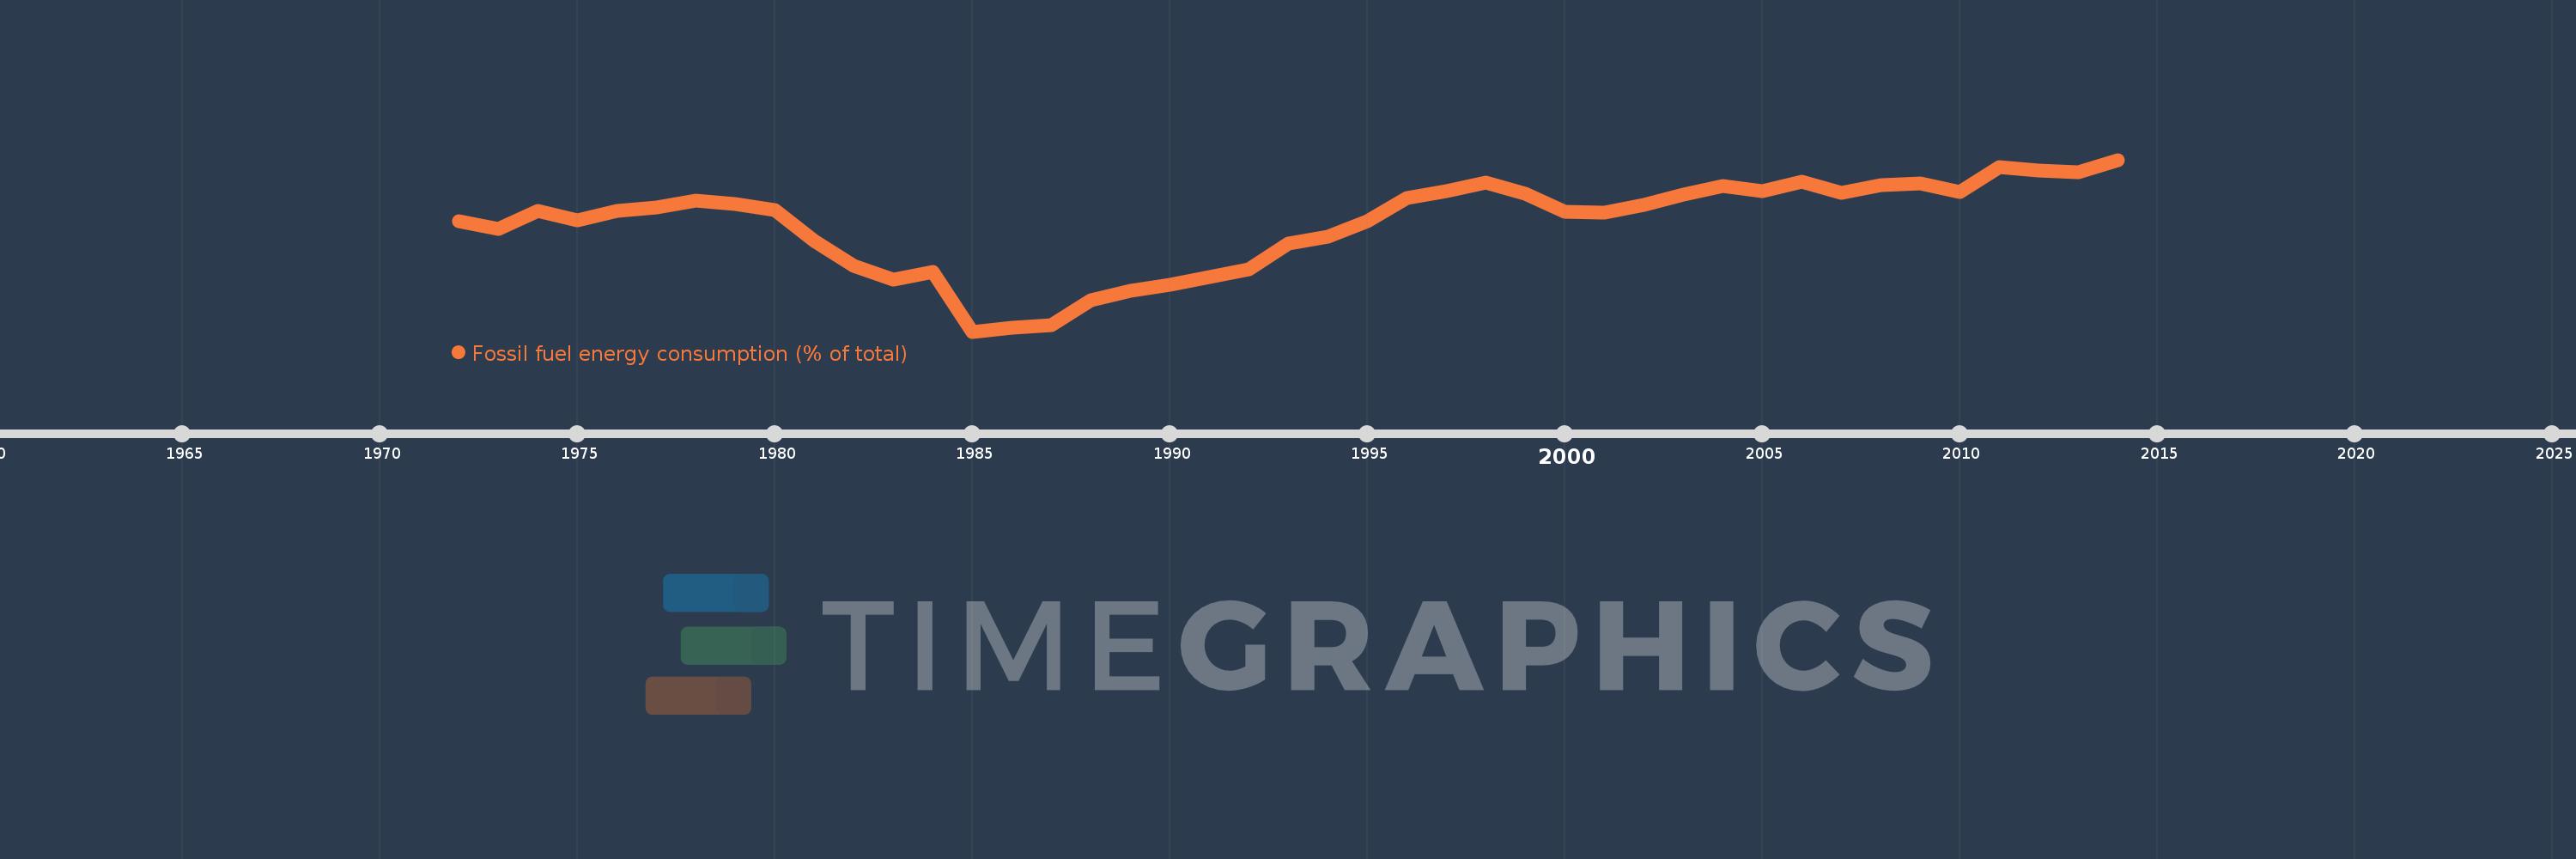
Fossil fuel energy consumption (% of total)
2014,2013,2012,2011,2010,2009,2008,2007,2006,2005,2004,2003,2002,2001,2000,1999,1998,1997,1996,1995,1994,1993,1992,1991,1990,1989,1988,1987,1986,1985,1984,1983,1982,1981,1980,1979,1978,1977,1976,1975,1974,1973,1972
This statistics in other country:
AlbaniaAlgeriaAngolaAntigua and BarbudaArab WorldArgentinaArmeniaAustraliaAustriaAzerbaijanBahamas, TheBahrainBangladeshBarbadosBelarusBelgiumBelizeBeninBhutanBoliviaBosnia and HerzegovinaBotswanaBrazilBrunei DarussalamBulgariaCabo VerdeCambodiaCameroonCanadaCaribbean small statesCentral Europe and the BalticsChileChinaColombiaComorosCongo, Dem. Rep.Congo, Rep.Costa RicaCote d'IvoireCroatiaCubaCuracaoCyprusCzech RepublicDenmarkDjiboutiDominicaDominican RepublicEarly-demographic dividendEast Asia & PacificEast Asia & Pacific (excluding high income)East Asia & Pacific (IDA & IBRD countries)EcuadorEgypt, Arab Rep.El SalvadorEquatorial GuineaEritreaEstoniaEthiopiaEuro areaEurope & Central AsiaEurope & Central Asia (excluding high income)Europe & Central Asia (IDA & IBRD countries)European UnionFijiFinlandFragile and conflict affected situationsFranceGabonGambia, TheGeorgiaGermanyGhanaGibraltarGreeceGrenadaGuatemalaGuinea-BissauGuyanaHaitiHeavily indebted poor countries (HIPC)High incomeHondurasHong Kong SAR, ChinaHungaryIBRD onlyIcelandIDA & IBRD totalIDA blendIDA onlyIDA totalIndiaIndonesiaIran, Islamic Rep.IraqIrelandIsraelItalyJamaicaJapanJordanKazakhstanKenyaKiribatiKorea, Dem. People’s Rep.Korea, Rep.KosovoKuwaitKyrgyz RepublicLate-demographic dividendLatin America & Caribbean Latin America & Caribbean (excluding high income)Latin America & the Caribbean (IDA & IBRD countries)LatviaLeast developed countries: UN classificationLebanonLesothoLibyaLithuaniaLow & middle incomeLow incomeLower middle incomeLuxembourgMacedonia, FYRMalaysiaMaldivesMaltaMarshall IslandsMauritiusMexicoMiddle East & North AfricaMiddle East & North Africa (excluding high income)Middle East & North Africa (IDA & IBRD countries)Middle incomeMoldovaMongoliaMontenegroMoroccoMozambiqueMyanmarNamibiaNepalNetherlandsNew ZealandNicaraguaNigerNigeriaNorth AmericaNorwayOECD membersOmanOther small statesPacific island small statesPakistanPalauPanamaParaguayPeruPhilippinesPolandPortugalPost-demographic dividendPre-demographic dividendQatarRomaniaRussian FederationSamoaSao Tome and PrincipeSaudi ArabiaSenegalSerbiaSeychellesSingaporeSlovak RepublicSloveniaSmall statesSolomon IslandsSouth AfricaSouth AsiaSouth Asia (IDA & IBRD)South SudanSpainSri LankaSt. Kitts and NevisSt. LuciaSt. Vincent and the GrenadinesSub-Saharan Africa Sub-Saharan Africa (excluding high income)Sub-Saharan Africa (IDA & IBRD countries)SudanSurinameSwazilandSwedenSwitzerlandSyrian Arab RepublicTajikistanTanzaniaThailandTimor-LesteTogoTongaTrinidad and TobagoTunisiaTurkeyUkraineUnited Arab EmiratesUnited KingdomUnited StatesUpper middle incomeUruguayUzbekistanVanuatuVenezuela, RBVietnamWorldYemen, Rep.ZambiaZimbabwe Timeline:
This timeline shows a graph from 1972 to 2014 of Philippines. No data until 1971. Number of actual observations by date: 43.
Source name:
World Development Indicators
Source organization:
IEA Statistics © OECD/IEA 2014 (http://www.iea.org/stats/index.asp), subject to https://www.iea.org/t&c/termsandconditions/
Categories, topics:
Energy & Mining
Last updated:
apr 23, 2017
Indicators value changes by year
Minimum:
34.603
jan 1, 1985
Maximum:
61.246
jan 1, 2014
At the date of observation
Value
Absolute change
Change from previous value
jan 1, 1972
51.683
+51.683
0.0%
jan 1, 1973
50.543
-1.14
-2.21%
jan 1, 1974
53.308
+2.765
5.47%
jan 1, 1975
51.809
-1.5
-2.81%
jan 1, 1976
53.262
+1.453
2.81%
jan 1, 1977
53.843
+0.582
1.09%
jan 1, 1978
54.952
+1.108
2.06%
jan 1, 1979
54.409
-0.543
-0.99%
jan 1, 1980
53.411
-0.998
-1.83%
jan 1, 1981
48.651
-4.76
-8.91%
jan 1, 1982
44.811
-3.84
-7.89%
jan 1, 1983
42.654
-2.158
-4.81%
jan 1, 1984
43.811
+1.158
2.71%
jan 1, 1985
34.603
-9.208
-21.02%
jan 1, 1986
35.183
+0.58
1.68%
jan 1, 1987
35.543
+0.36
1.02%
jan 1, 1988
39.427
+3.885
10.93%
jan 1, 1989
40.952
+1.525
3.87%
jan 1, 1990
41.924
+0.972
2.37%
jan 1, 1991
43.079
+1.155
2.76%
jan 1, 1992
44.28
+1.201
2.79%
jan 1, 1993
48.23
+3.949
8.92%
jan 1, 1994
49.273
+1.044
2.16%
jan 1, 1995
51.77
+2.497
5.07%
jan 1, 1996
55.371
+3.601
6.96%
jan 1, 1997
56.334
+0.963
1.74%
jan 1, 1998
57.722
+1.388
2.46%
jan 1, 1999
55.925
-1.798
-3.11%
jan 1, 2000
53.216
-2.709
-4.84%
jan 1, 2001
53.069
-0.148
-0.28%
jan 1, 2002
54.305
+1.236
2.33%
jan 1, 2003
55.873
+1.568
2.89%
jan 1, 2004
57.216
+1.343
2.4%
jan 1, 2005
56.383
-0.833
-1.46%
jan 1, 2006
57.813
+1.43
2.54%
jan 1, 2007
56.182
-1.63
-2.82%
jan 1, 2008
57.275
+1.092
1.94%
jan 1, 2009
57.63
+0.355
0.62%
jan 1, 2010
56.263
-1.367
-2.37%
jan 1, 2011
60.111
+3.848
6.84%
jan 1, 2012
59.564
-0.547
-0.91%
jan 1, 2013
59.294
-0.27
-0.45%
jan 1, 2014
61.246
+1.952
3.29%
Ranking of countries by current statistics by years


Comments: