29
/
en
AIzaSyAYiBZKx7MnpbEhh9jyipgxe19OcubqV5w
April 1, 2024
67741
Angola
AGO
true
2
1
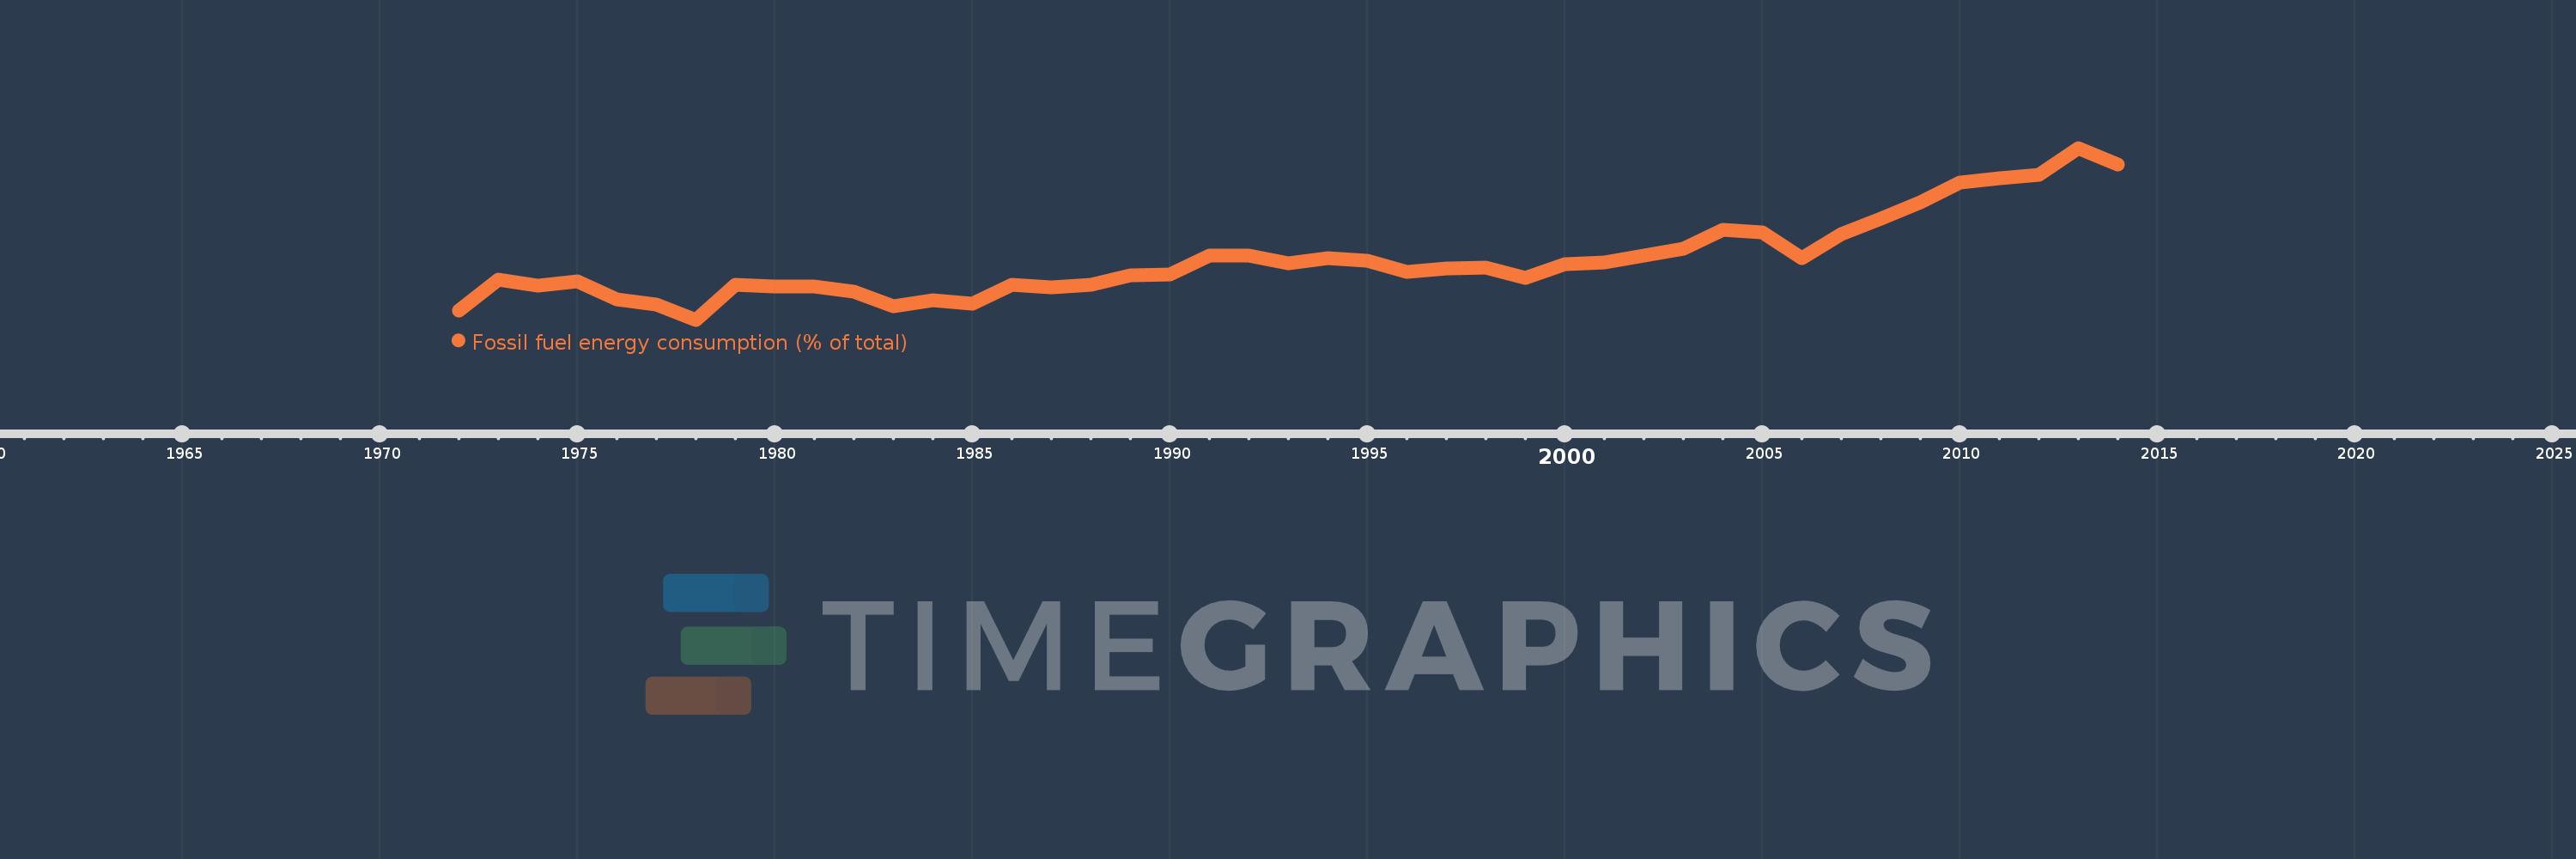
Fossil fuel energy consumption (% of total)
2014,2013,2012,2011,2010,2009,2008,2007,2006,2005,2004,2003,2002,2001,2000,1999,1998,1997,1996,1995,1994,1993,1992,1991,1990,1989,1988,1987,1986,1985,1984,1983,1982,1981,1980,1979,1978,1977,1976,1975,1974,1973,1972
This statistics in other country:
AlbaniaAlgeriaAngolaAntigua and BarbudaArab WorldArgentinaArmeniaAustraliaAustriaAzerbaijanBahamas, TheBahrainBangladeshBarbadosBelarusBelgiumBelizeBeninBhutanBoliviaBosnia and HerzegovinaBotswanaBrazilBrunei DarussalamBulgariaCabo VerdeCambodiaCameroonCanadaCaribbean small statesCentral Europe and the BalticsChileChinaColombiaComorosCongo, Dem. Rep.Congo, Rep.Costa RicaCote d'IvoireCroatiaCubaCuracaoCyprusCzech RepublicDenmarkDjiboutiDominicaDominican RepublicEarly-demographic dividendEast Asia & PacificEast Asia & Pacific (excluding high income)East Asia & Pacific (IDA & IBRD countries)EcuadorEgypt, Arab Rep.El SalvadorEquatorial GuineaEritreaEstoniaEthiopiaEuro areaEurope & Central AsiaEurope & Central Asia (excluding high income)Europe & Central Asia (IDA & IBRD countries)European UnionFijiFinlandFragile and conflict affected situationsFranceGabonGambia, TheGeorgiaGermanyGhanaGibraltarGreeceGrenadaGuatemalaGuinea-BissauGuyanaHaitiHeavily indebted poor countries (HIPC)High incomeHondurasHong Kong SAR, ChinaHungaryIBRD onlyIcelandIDA & IBRD totalIDA blendIDA onlyIDA totalIndiaIndonesiaIran, Islamic Rep.IraqIrelandIsraelItalyJamaicaJapanJordanKazakhstanKenyaKiribatiKorea, Dem. People’s Rep.Korea, Rep.KosovoKuwaitKyrgyz RepublicLate-demographic dividendLatin America & Caribbean Latin America & Caribbean (excluding high income)Latin America & the Caribbean (IDA & IBRD countries)LatviaLeast developed countries: UN classificationLebanonLesothoLibyaLithuaniaLow & middle incomeLow incomeLower middle incomeLuxembourgMacedonia, FYRMalaysiaMaldivesMaltaMarshall IslandsMauritiusMexicoMiddle East & North AfricaMiddle East & North Africa (excluding high income)Middle East & North Africa (IDA & IBRD countries)Middle incomeMoldovaMongoliaMontenegroMoroccoMozambiqueMyanmarNamibiaNepalNetherlandsNew ZealandNicaraguaNigerNigeriaNorth AmericaNorwayOECD membersOmanOther small statesPacific island small statesPakistanPalauPanamaParaguayPeruPhilippinesPolandPortugalPost-demographic dividendPre-demographic dividendQatarRomaniaRussian FederationSamoaSao Tome and PrincipeSaudi ArabiaSenegalSerbiaSeychellesSingaporeSlovak RepublicSloveniaSmall statesSolomon IslandsSouth AfricaSouth AsiaSouth Asia (IDA & IBRD)South SudanSpainSri LankaSt. Kitts and NevisSt. LuciaSt. Vincent and the GrenadinesSub-Saharan Africa Sub-Saharan Africa (excluding high income)Sub-Saharan Africa (IDA & IBRD countries)SudanSurinameSwazilandSwedenSwitzerlandSyrian Arab RepublicTajikistanTanzaniaThailandTimor-LesteTogoTongaTrinidad and TobagoTunisiaTurkeyUkraineUnited Arab EmiratesUnited KingdomUnited StatesUpper middle incomeUruguayUzbekistanVanuatuVenezuela, RBVietnamWorldYemen, Rep.ZambiaZimbabwe Timeline:
This timeline shows a graph from 1972 to 2014 of Angola. No data until 1971. Number of actual observations by date: 43.
Source name:
World Development Indicators
Source organization:
IEA Statistics © OECD/IEA 2014 (http://www.iea.org/stats/index.asp), subject to https://www.iea.org/t&c/termsandconditions/
Categories, topics:
Energy & Mining
Last updated:
apr 23, 2017
Indicators value changes by year
Minimum:
14.225
jan 1, 1978
Maximum:
44.179
jan 1, 2013
At the date of observation
Value
Absolute change
Change from previous value
jan 1, 1972
15.834
+15.834
0.0%
jan 1, 1973
21.261
+5.427
34.27%
jan 1, 1974
20.107
-1.154
-5.43%
jan 1, 1975
20.926
+0.819
4.07%
jan 1, 1976
17.826
-3.1
-14.81%
jan 1, 1977
16.822
-1.004
-5.63%
jan 1, 1978
14.225
-2.597
-15.44%
jan 1, 1979
20.384
+6.159
43.3%
jan 1, 1980
19.956
-0.428
-2.1%
jan 1, 1981
19.963
+0.007
0.04%
jan 1, 1982
19.159
-0.804
-4.03%
jan 1, 1983
16.617
-2.543
-13.27%
jan 1, 1984
17.623
+1.007
6.06%
jan 1, 1985
17.065
-0.558
-3.17%
jan 1, 1986
20.308
+3.242
19.0%
jan 1, 1987
19.891
-0.416
-2.05%
jan 1, 1988
20.384
+0.493
2.48%
jan 1, 1989
22.018
+1.634
8.01%
jan 1, 1990
22.103
+0.085
0.39%
jan 1, 1991
25.48
+3.377
15.28%
jan 1, 1992
25.483
+0.002
0.01%
jan 1, 1993
24.098
-1.385
-5.43%
jan 1, 1994
24.965
+0.867
3.6%
jan 1, 1995
24.44
-0.525
-2.1%
jan 1, 1996
22.622
-1.818
-7.44%
jan 1, 1997
23.176
+0.554
2.45%
jan 1, 1998
23.386
+0.211
0.91%
jan 1, 1999
21.508
-1.879
-8.03%
jan 1, 2000
23.872
+2.364
10.99%
jan 1, 2001
24.183
+0.311
1.3%
jan 1, 2002
25.408
+1.225
5.07%
jan 1, 2003
26.623
+1.215
4.78%
jan 1, 2004
29.855
+3.232
12.14%
jan 1, 2005
29.477
-0.378
-1.27%
jan 1, 2006
24.983
-4.494
-15.25%
jan 1, 2007
29.132
+4.149
16.61%
jan 1, 2008
31.802
+2.67
9.16%
jan 1, 2009
34.645
+2.843
8.94%
jan 1, 2010
38.071
+3.427
9.89%
jan 1, 2011
38.957
+0.885
2.32%
jan 1, 2012
39.558
+0.601
1.54%
jan 1, 2013
44.179
+4.621
11.68%
jan 1, 2014
41.32
-2.859
-6.47%
Ranking of countries by current statistics by years


Comments: