29
/
en
AIzaSyAYiBZKx7MnpbEhh9jyipgxe19OcubqV5w
April 1, 2024
27278
East Asia & Pacific
EAS
false
2
1
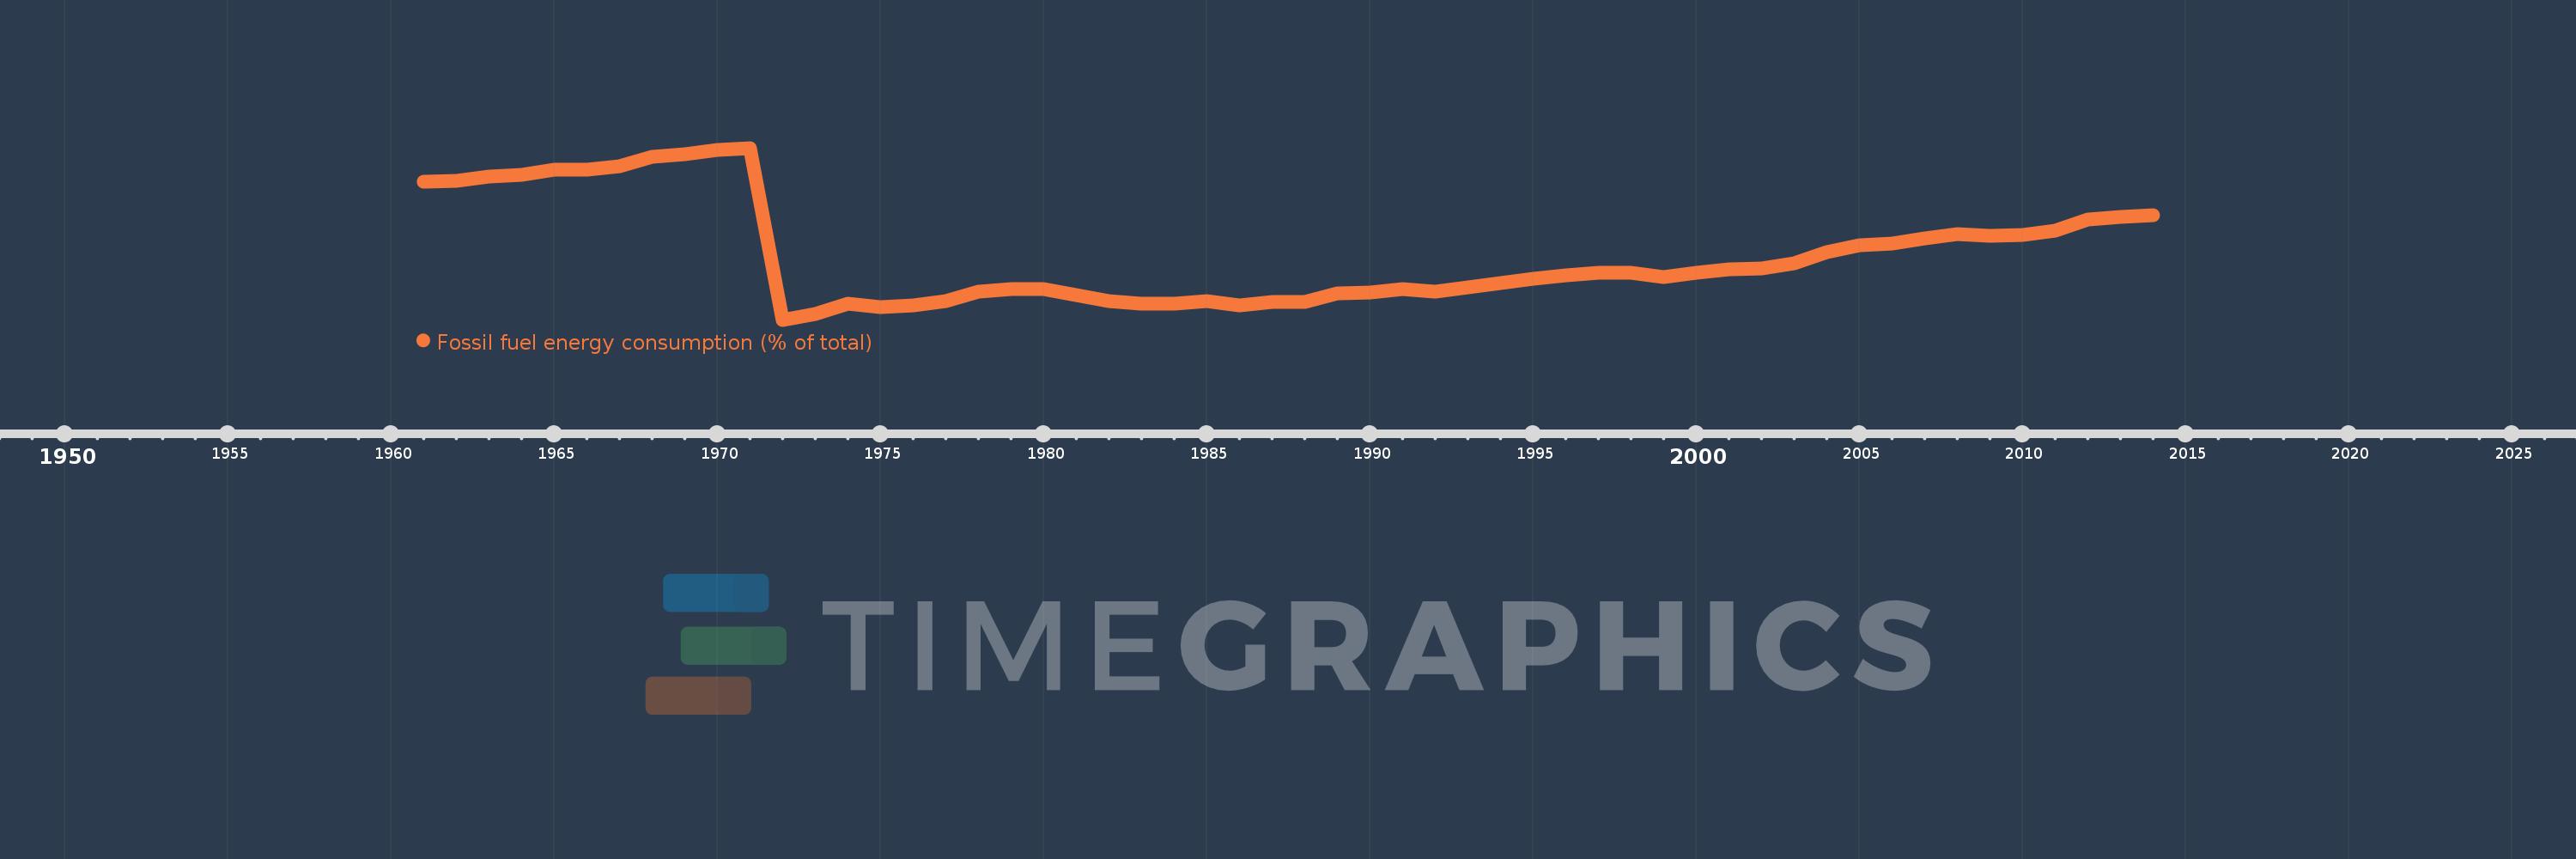
Fossil fuel energy consumption (% of total)
2014,2013,2012,2011,2010,2009,2008,2007,2006,2005,2004,2003,2002,2001,2000,1999,1998,1997,1996,1995,1994,1993,1992,1991,1990,1989,1988,1987,1986,1985,1984,1983,1982,1981,1980,1979,1978,1977,1976,1975,1974,1973,1972,1971,1970,1969,1968,1967,1966,1965,1964,1963,1962,1961
This statistics in other country:
AlbaniaAlgeriaAngolaAntigua and BarbudaArab WorldArgentinaArmeniaAustraliaAustriaAzerbaijanBahamas, TheBahrainBangladeshBarbadosBelarusBelgiumBelizeBeninBhutanBoliviaBosnia and HerzegovinaBotswanaBrazilBrunei DarussalamBulgariaCabo VerdeCambodiaCameroonCanadaCaribbean small statesCentral Europe and the BalticsChileChinaColombiaComorosCongo, Dem. Rep.Congo, Rep.Costa RicaCote d'IvoireCroatiaCubaCuracaoCyprusCzech RepublicDenmarkDjiboutiDominicaDominican RepublicEarly-demographic dividendEast Asia & PacificEast Asia & Pacific (excluding high income)East Asia & Pacific (IDA & IBRD countries)EcuadorEgypt, Arab Rep.El SalvadorEquatorial GuineaEritreaEstoniaEthiopiaEuro areaEurope & Central AsiaEurope & Central Asia (excluding high income)Europe & Central Asia (IDA & IBRD countries)European UnionFijiFinlandFragile and conflict affected situationsFranceGabonGambia, TheGeorgiaGermanyGhanaGibraltarGreeceGrenadaGuatemalaGuinea-BissauGuyanaHaitiHeavily indebted poor countries (HIPC)High incomeHondurasHong Kong SAR, ChinaHungaryIBRD onlyIcelandIDA & IBRD totalIDA blendIDA onlyIDA totalIndiaIndonesiaIran, Islamic Rep.IraqIrelandIsraelItalyJamaicaJapanJordanKazakhstanKenyaKiribatiKorea, Dem. People’s Rep.Korea, Rep.KosovoKuwaitKyrgyz RepublicLate-demographic dividendLatin America & Caribbean Latin America & Caribbean (excluding high income)Latin America & the Caribbean (IDA & IBRD countries)LatviaLeast developed countries: UN classificationLebanonLesothoLibyaLithuaniaLow & middle incomeLow incomeLower middle incomeLuxembourgMacedonia, FYRMalaysiaMaldivesMaltaMarshall IslandsMauritiusMexicoMiddle East & North AfricaMiddle East & North Africa (excluding high income)Middle East & North Africa (IDA & IBRD countries)Middle incomeMoldovaMongoliaMontenegroMoroccoMozambiqueMyanmarNamibiaNepalNetherlandsNew ZealandNicaraguaNigerNigeriaNorth AmericaNorwayOECD membersOmanOther small statesPacific island small statesPakistanPalauPanamaParaguayPeruPhilippinesPolandPortugalPost-demographic dividendPre-demographic dividendQatarRomaniaRussian FederationSamoaSao Tome and PrincipeSaudi ArabiaSenegalSerbiaSeychellesSingaporeSlovak RepublicSloveniaSmall statesSolomon IslandsSouth AfricaSouth AsiaSouth Asia (IDA & IBRD)South SudanSpainSri LankaSt. Kitts and NevisSt. LuciaSt. Vincent and the GrenadinesSub-Saharan Africa Sub-Saharan Africa (excluding high income)Sub-Saharan Africa (IDA & IBRD countries)SudanSurinameSwazilandSwedenSwitzerlandSyrian Arab RepublicTajikistanTanzaniaThailandTimor-LesteTogoTongaTrinidad and TobagoTunisiaTurkeyUkraineUnited Arab EmiratesUnited KingdomUnited StatesUpper middle incomeUruguayUzbekistanVanuatuVenezuela, RBVietnamWorldYemen, Rep.ZambiaZimbabwe Timeline:
This timeline shows a graph from 1961 to 2014 of East Asia & Pacific. No data until 1960. Number of actual observations by date: 54.
Source name:
World Development Indicators
Source organization:
IEA Statistics © OECD/IEA 2014 (http://www.iea.org/stats/index.asp), subject to https://www.iea.org/t&c/termsandconditions/
Categories, topics:
Energy & Mining
Last updated:
apr 23, 2017
Indicators value changes by year
Maximum:
95.526
jan 1, 1971
At the date of observation
Value
Absolute change
Change from previous value
jan 1, 1961
91.148
+91.148
0.0%
jan 1, 1962
91.191
+0.043
0.05%
jan 1, 1963
91.79
+0.598
0.66%
jan 1, 1964
91.996
+0.206
0.22%
jan 1, 1965
92.678
+0.682
0.74%
jan 1, 1966
92.686
+0.008
0.01%
jan 1, 1967
93.119
+0.433
0.47%
jan 1, 1968
94.405
+1.286
1.38%
jan 1, 1969
94.721
+0.316
0.34%
jan 1, 1970
95.233
+0.512
0.54%
jan 1, 1971
95.526
+0.292
0.31%
jan 1, 1972
72.97
-22.555
-23.61%
jan 1, 1973
73.748
+0.777
1.07%
jan 1, 1974
75.093
+1.345
1.82%
jan 1, 1975
74.623
-0.47
-0.63%
jan 1, 1976
74.825
+0.203
0.27%
jan 1, 1977
75.385
+0.56
0.75%
jan 1, 1978
76.695
+1.31
1.74%
jan 1, 1979
76.974
+0.279
0.36%
jan 1, 1980
76.976
+0.002
0.0%
jan 1, 1981
76.198
-0.778
-1.01%
jan 1, 1982
75.422
-0.776
-1.02%
jan 1, 1983
75.053
-0.369
-0.49%
jan 1, 1984
75.051
-0.002
0.0%
jan 1, 1985
75.463
+0.412
0.55%
jan 1, 1986
74.9
-0.563
-0.75%
jan 1, 1987
75.282
+0.381
0.51%
jan 1, 1988
75.314
+0.032
0.04%
jan 1, 1989
76.381
+1.068
1.42%
jan 1, 1990
76.54
+0.159
0.21%
jan 1, 1991
77.013
+0.473
0.62%
jan 1, 1992
76.655
-0.358
-0.47%
jan 1, 1993
77.239
+0.584
0.76%
jan 1, 1994
77.738
+0.499
0.65%
jan 1, 1995
78.308
+0.57
0.73%
jan 1, 1996
78.761
+0.452
0.58%
jan 1, 1997
79.133
+0.372
0.47%
jan 1, 1998
79.166
+0.033
0.04%
jan 1, 1999
78.596
-0.571
-0.72%
jan 1, 2000
79.086
+0.49
0.62%
jan 1, 2001
79.57
+0.484
0.61%
jan 1, 2002
79.664
+0.094
0.12%
jan 1, 2003
80.385
+0.722
0.91%
jan 1, 2004
81.881
+1.496
1.86%
jan 1, 2005
82.734
+0.853
1.04%
jan 1, 2006
82.994
+0.26
0.31%
jan 1, 2007
83.629
+0.634
0.76%
jan 1, 2008
84.247
+0.618
0.74%
jan 1, 2009
83.941
-0.306
-0.36%
jan 1, 2010
84.136
+0.195
0.23%
jan 1, 2011
84.671
+0.535
0.64%
jan 1, 2012
86.111
+1.441
1.7%
jan 1, 2013
86.456
+0.345
0.4%
jan 1, 2014
86.706
+0.25
0.29%
Ranking of countries by current statistics by years


Comments: