29
/
en
AIzaSyAYiBZKx7MnpbEhh9jyipgxe19OcubqV5w
April 1, 2024
115783
Cuba
CUB
true
2
1
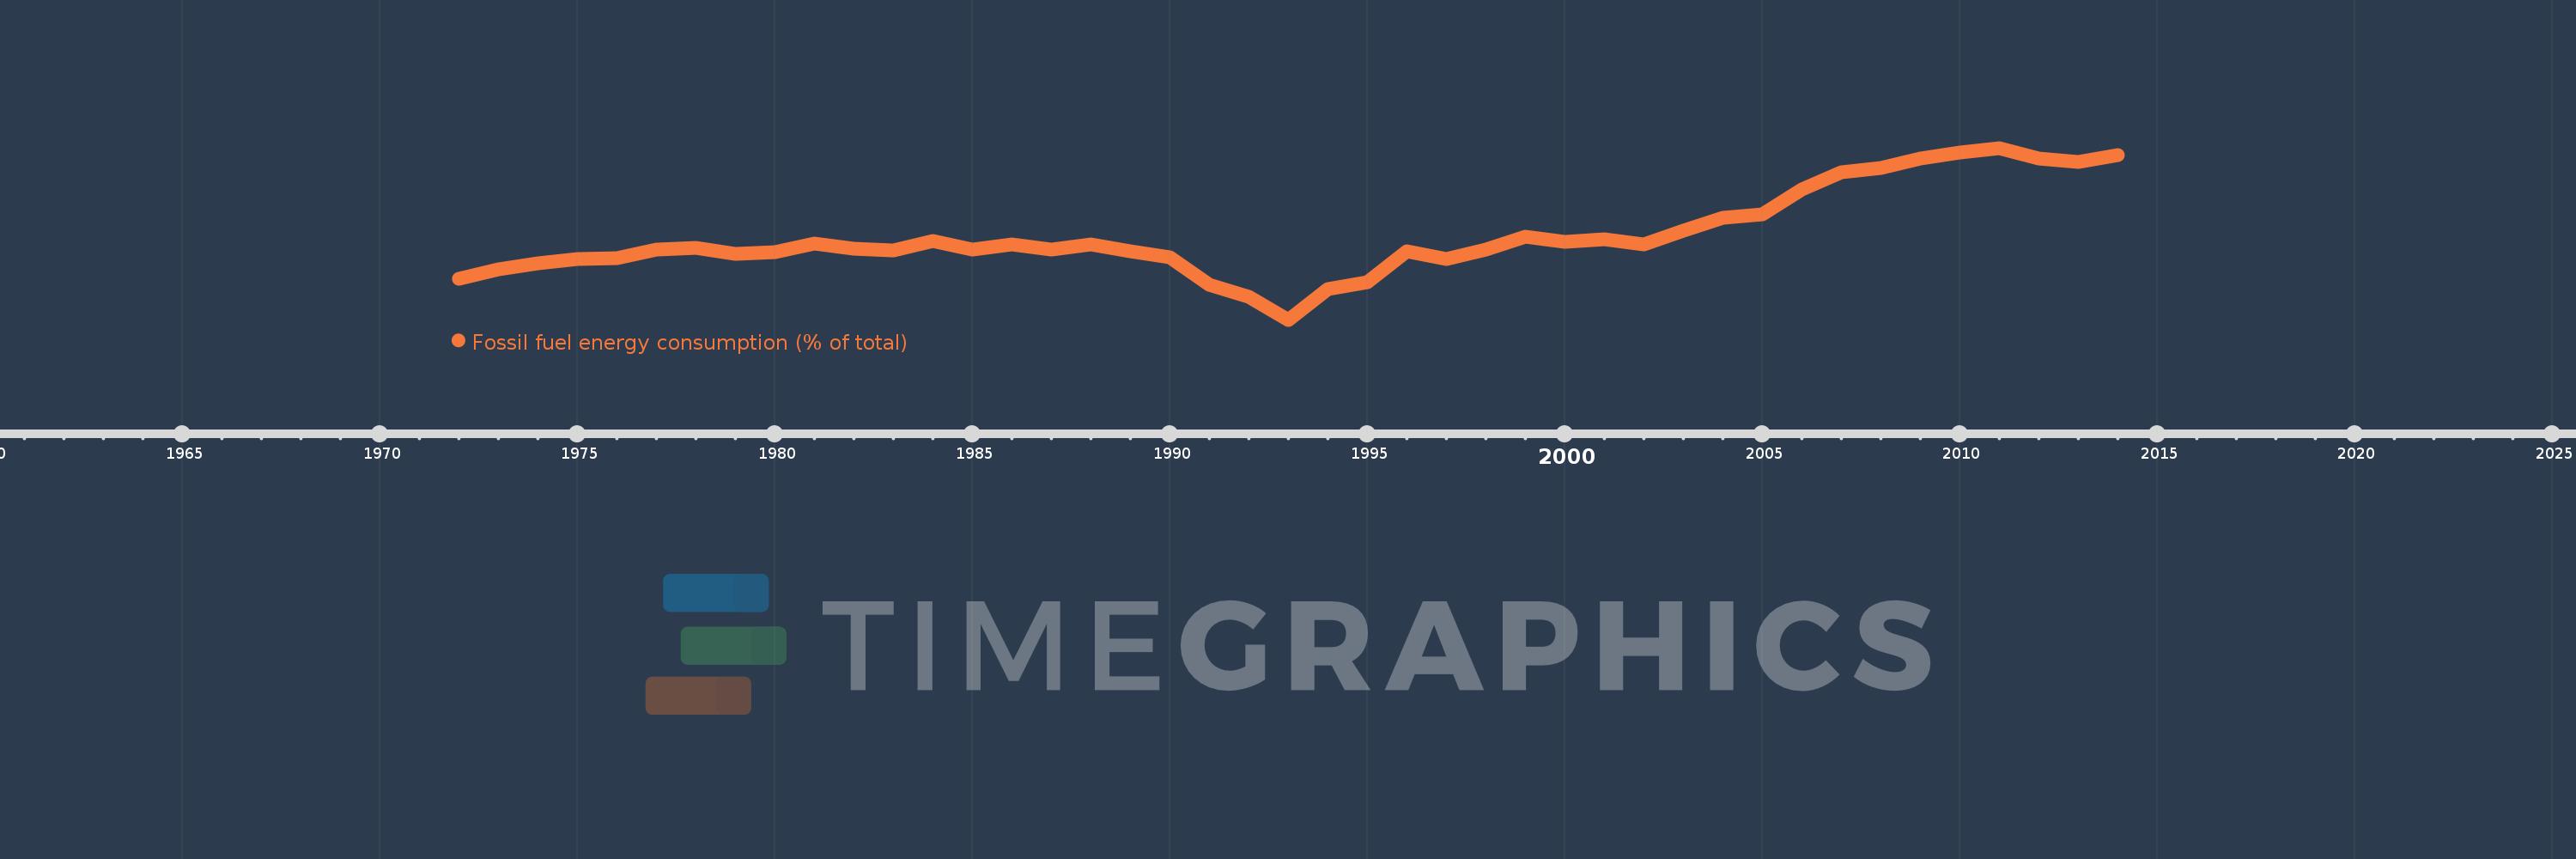
Fossil fuel energy consumption (% of total)
2014,2013,2012,2011,2010,2009,2008,2007,2006,2005,2004,2003,2002,2001,2000,1999,1998,1997,1996,1995,1994,1993,1992,1991,1990,1989,1988,1987,1986,1985,1984,1983,1982,1981,1980,1979,1978,1977,1976,1975,1974,1973,1972
This statistics in other country:
AlbaniaAlgeriaAngolaAntigua and BarbudaArab WorldArgentinaArmeniaAustraliaAustriaAzerbaijanBahamas, TheBahrainBangladeshBarbadosBelarusBelgiumBelizeBeninBhutanBoliviaBosnia and HerzegovinaBotswanaBrazilBrunei DarussalamBulgariaCabo VerdeCambodiaCameroonCanadaCaribbean small statesCentral Europe and the BalticsChileChinaColombiaComorosCongo, Dem. Rep.Congo, Rep.Costa RicaCote d'IvoireCroatiaCubaCuracaoCyprusCzech RepublicDenmarkDjiboutiDominicaDominican RepublicEarly-demographic dividendEast Asia & PacificEast Asia & Pacific (excluding high income)East Asia & Pacific (IDA & IBRD countries)EcuadorEgypt, Arab Rep.El SalvadorEquatorial GuineaEritreaEstoniaEthiopiaEuro areaEurope & Central AsiaEurope & Central Asia (excluding high income)Europe & Central Asia (IDA & IBRD countries)European UnionFijiFinlandFragile and conflict affected situationsFranceGabonGambia, TheGeorgiaGermanyGhanaGibraltarGreeceGrenadaGuatemalaGuinea-BissauGuyanaHaitiHeavily indebted poor countries (HIPC)High incomeHondurasHong Kong SAR, ChinaHungaryIBRD onlyIcelandIDA & IBRD totalIDA blendIDA onlyIDA totalIndiaIndonesiaIran, Islamic Rep.IraqIrelandIsraelItalyJamaicaJapanJordanKazakhstanKenyaKiribatiKorea, Dem. People’s Rep.Korea, Rep.KosovoKuwaitKyrgyz RepublicLate-demographic dividendLatin America & Caribbean Latin America & Caribbean (excluding high income)Latin America & the Caribbean (IDA & IBRD countries)LatviaLeast developed countries: UN classificationLebanonLesothoLibyaLithuaniaLow & middle incomeLow incomeLower middle incomeLuxembourgMacedonia, FYRMalaysiaMaldivesMaltaMarshall IslandsMauritiusMexicoMiddle East & North AfricaMiddle East & North Africa (excluding high income)Middle East & North Africa (IDA & IBRD countries)Middle incomeMoldovaMongoliaMontenegroMoroccoMozambiqueMyanmarNamibiaNepalNetherlandsNew ZealandNicaraguaNigerNigeriaNorth AmericaNorwayOECD membersOmanOther small statesPacific island small statesPakistanPalauPanamaParaguayPeruPhilippinesPolandPortugalPost-demographic dividendPre-demographic dividendQatarRomaniaRussian FederationSamoaSao Tome and PrincipeSaudi ArabiaSenegalSerbiaSeychellesSingaporeSlovak RepublicSloveniaSmall statesSolomon IslandsSouth AfricaSouth AsiaSouth Asia (IDA & IBRD)South SudanSpainSri LankaSt. Kitts and NevisSt. LuciaSt. Vincent and the GrenadinesSub-Saharan Africa Sub-Saharan Africa (excluding high income)Sub-Saharan Africa (IDA & IBRD countries)SudanSurinameSwazilandSwedenSwitzerlandSyrian Arab RepublicTajikistanTanzaniaThailandTimor-LesteTogoTongaTrinidad and TobagoTunisiaTurkeyUkraineUnited Arab EmiratesUnited KingdomUnited StatesUpper middle incomeUruguayUzbekistanVanuatuVenezuela, RBVietnamWorldYemen, Rep.ZambiaZimbabwe Timeline:
This timeline shows a graph from 1972 to 2014 of Cuba. No data until 1971. Number of actual observations by date: 43.
Source name:
World Development Indicators
Source organization:
IEA Statistics © OECD/IEA 2014 (http://www.iea.org/stats/index.asp), subject to https://www.iea.org/t&c/termsandconditions/
Categories, topics:
Energy & Mining
Last updated:
apr 23, 2017
Indicators value changes by year
Minimum:
53.198
jan 1, 1993
Maximum:
88.761
jan 1, 2011
At the date of observation
Value
Absolute change
Change from previous value
jan 1, 1972
61.714
+61.714
0.0%
jan 1, 1973
63.663
+1.949
3.16%
jan 1, 1974
64.918
+1.254
1.97%
jan 1, 1975
65.769
+0.851
1.31%
jan 1, 1976
66.025
+0.257
0.39%
jan 1, 1977
67.772
+1.746
2.65%
jan 1, 1978
68.047
+0.275
0.41%
jan 1, 1979
66.892
-1.155
-1.7%
jan 1, 1980
67.192
+0.3
0.45%
jan 1, 1981
69.04
+1.848
2.75%
jan 1, 1982
67.882
-1.159
-1.68%
jan 1, 1983
67.466
-0.416
-0.61%
jan 1, 1984
69.559
+2.093
3.1%
jan 1, 1985
67.719
-1.84
-2.65%
jan 1, 1986
68.733
+1.015
1.5%
jan 1, 1987
67.766
-0.968
-1.41%
jan 1, 1988
68.827
+1.062
1.57%
jan 1, 1989
67.458
-1.37
-1.99%
jan 1, 1990
66.099
-1.359
-2.01%
jan 1, 1991
60.489
-5.61
-8.49%
jan 1, 1992
57.947
-2.543
-4.2%
jan 1, 1993
53.198
-4.749
-8.2%
jan 1, 1994
59.529
+6.331
11.9%
jan 1, 1995
60.921
+1.392
2.34%
jan 1, 1996
67.284
+6.363
10.44%
jan 1, 1997
65.703
-1.58
-2.35%
jan 1, 1998
67.785
+2.081
3.17%
jan 1, 1999
70.463
+2.678
3.95%
jan 1, 2000
69.329
-1.135
-1.61%
jan 1, 2001
69.89
+0.561
0.81%
jan 1, 2002
68.831
-1.059
-1.51%
jan 1, 2003
71.61
+2.779
4.04%
jan 1, 2004
74.296
+2.686
3.75%
jan 1, 2005
74.931
+0.634
0.85%
jan 1, 2006
80.106
+5.176
6.91%
jan 1, 2007
83.643
+3.537
4.41%
jan 1, 2008
84.554
+0.911
1.09%
jan 1, 2009
86.524
+1.97
2.33%
jan 1, 2010
87.742
+1.218
1.41%
jan 1, 2011
88.761
+1.019
1.16%
jan 1, 2012
86.618
-2.143
-2.41%
jan 1, 2013
85.84
-0.778
-0.9%
jan 1, 2014
87.334
+1.494
1.74%
Ranking of countries by current statistics by years


Comments: