29
/
en
AIzaSyAYiBZKx7MnpbEhh9jyipgxe19OcubqV5w
April 1, 2024
240442
Singapore
SGP
true
2
1
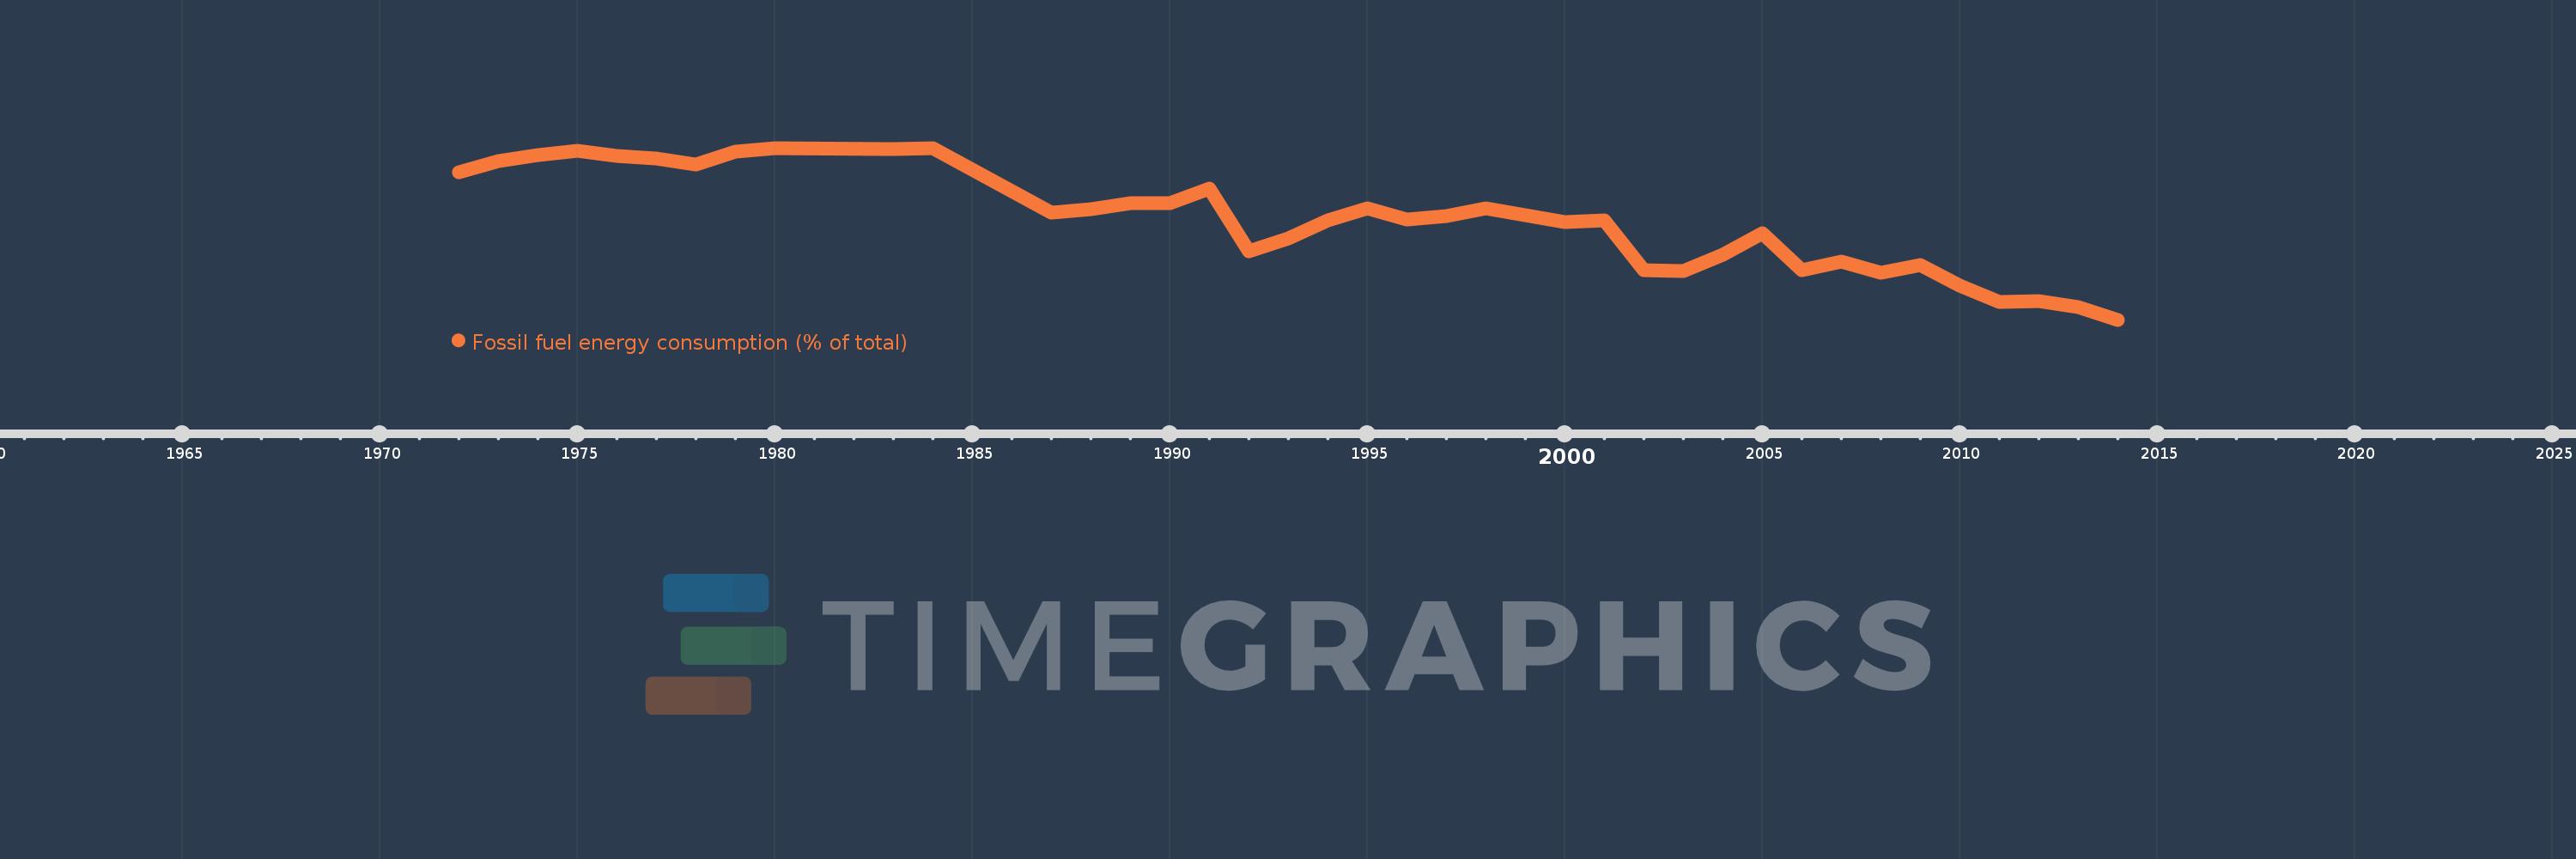
Fossil fuel energy consumption (% of total)
2014,2013,2012,2011,2010,2009,2008,2007,2006,2005,2004,2003,2002,2001,2000,1999,1998,1997,1996,1995,1994,1993,1992,1991,1990,1989,1988,1987,1984,1983,1980,1979,1978,1977,1976,1975,1974,1973,1972
This statistics in other country:
AlbaniaAlgeriaAngolaAntigua and BarbudaArab WorldArgentinaArmeniaAustraliaAustriaAzerbaijanBahamas, TheBahrainBangladeshBarbadosBelarusBelgiumBelizeBeninBhutanBoliviaBosnia and HerzegovinaBotswanaBrazilBrunei DarussalamBulgariaCabo VerdeCambodiaCameroonCanadaCaribbean small statesCentral Europe and the BalticsChileChinaColombiaComorosCongo, Dem. Rep.Congo, Rep.Costa RicaCote d'IvoireCroatiaCubaCuracaoCyprusCzech RepublicDenmarkDjiboutiDominicaDominican RepublicEarly-demographic dividendEast Asia & PacificEast Asia & Pacific (excluding high income)East Asia & Pacific (IDA & IBRD countries)EcuadorEgypt, Arab Rep.El SalvadorEquatorial GuineaEritreaEstoniaEthiopiaEuro areaEurope & Central AsiaEurope & Central Asia (excluding high income)Europe & Central Asia (IDA & IBRD countries)European UnionFijiFinlandFragile and conflict affected situationsFranceGabonGambia, TheGeorgiaGermanyGhanaGibraltarGreeceGrenadaGuatemalaGuinea-BissauGuyanaHaitiHeavily indebted poor countries (HIPC)High incomeHondurasHong Kong SAR, ChinaHungaryIBRD onlyIcelandIDA & IBRD totalIDA blendIDA onlyIDA totalIndiaIndonesiaIran, Islamic Rep.IraqIrelandIsraelItalyJamaicaJapanJordanKazakhstanKenyaKiribatiKorea, Dem. People’s Rep.Korea, Rep.KosovoKuwaitKyrgyz RepublicLate-demographic dividendLatin America & Caribbean Latin America & Caribbean (excluding high income)Latin America & the Caribbean (IDA & IBRD countries)LatviaLeast developed countries: UN classificationLebanonLesothoLibyaLithuaniaLow & middle incomeLow incomeLower middle incomeLuxembourgMacedonia, FYRMalaysiaMaldivesMaltaMarshall IslandsMauritiusMexicoMiddle East & North AfricaMiddle East & North Africa (excluding high income)Middle East & North Africa (IDA & IBRD countries)Middle incomeMoldovaMongoliaMontenegroMoroccoMozambiqueMyanmarNamibiaNepalNetherlandsNew ZealandNicaraguaNigerNigeriaNorth AmericaNorwayOECD membersOmanOther small statesPacific island small statesPakistanPalauPanamaParaguayPeruPhilippinesPolandPortugalPost-demographic dividendPre-demographic dividendQatarRomaniaRussian FederationSamoaSao Tome and PrincipeSaudi ArabiaSenegalSerbiaSeychellesSingaporeSlovak RepublicSloveniaSmall statesSolomon IslandsSouth AfricaSouth AsiaSouth Asia (IDA & IBRD)South SudanSpainSri LankaSt. Kitts and NevisSt. LuciaSt. Vincent and the GrenadinesSub-Saharan Africa Sub-Saharan Africa (excluding high income)Sub-Saharan Africa (IDA & IBRD countries)SudanSurinameSwazilandSwedenSwitzerlandSyrian Arab RepublicTajikistanTanzaniaThailandTimor-LesteTogoTongaTrinidad and TobagoTunisiaTurkeyUkraineUnited Arab EmiratesUnited KingdomUnited StatesUpper middle incomeUruguayUzbekistanVanuatuVenezuela, RBVietnamWorldYemen, Rep.ZambiaZimbabwe Timeline:
This timeline shows a graph from 1972 to 2014 of Singapore. No data until 1971. Number of actual observations by date: 39.
Source name:
World Development Indicators
Source organization:
IEA Statistics © OECD/IEA 2014 (http://www.iea.org/stats/index.asp), subject to https://www.iea.org/t&c/termsandconditions/
Categories, topics:
Energy & Mining
Last updated:
apr 23, 2017
Indicators value changes by year
Minimum:
97.429
jan 1, 2014
Maximum:
99.992
jan 1, 1980
At the date of observation
Value
Absolute change
Change from previous value
jan 1, 1972
99.633
+99.633
0.0%
jan 1, 1973
99.793
+0.16
0.16%
jan 1, 1974
99.888
+0.095
0.1%
jan 1, 1975
99.948
+0.059
0.06%
jan 1, 1976
99.868
-0.079
-0.08%
jan 1, 1977
99.832
-0.037
-0.04%
jan 1, 1978
99.744
-0.087
-0.09%
jan 1, 1979
99.931
+0.187
0.19%
jan 1, 1980
99.992
+0.061
0.06%
jan 1, 1983
99.979
-0.013
-0.01%
jan 1, 1984
99.989
+0.01
0.01%
jan 1, 1987
99.025
-0.964
-0.96%
jan 1, 1988
99.084
+0.059
0.06%
jan 1, 1989
99.174
+0.09
0.09%
jan 1, 1990
99.174
+0.0
0.0%
jan 1, 1991
99.392
+0.218
0.22%
jan 1, 1992
98.454
-0.938
-0.94%
jan 1, 1993
98.637
+0.183
0.19%
jan 1, 1994
98.913
+0.276
0.28%
jan 1, 1995
99.085
+0.172
0.17%
jan 1, 1996
98.928
-0.157
-0.16%
jan 1, 1997
98.973
+0.045
0.05%
jan 1, 1998
99.085
+0.112
0.11%
jan 1, 1999
98.988
-0.097
-0.1%
jan 1, 2000
98.888
-0.1
-0.1%
jan 1, 2001
98.918
+0.03
0.03%
jan 1, 2002
98.168
-0.75
-0.76%
jan 1, 2003
98.155
-0.013
-0.01%
jan 1, 2004
98.404
+0.249
0.25%
jan 1, 2005
98.714
+0.309
0.31%
jan 1, 2006
98.171
-0.543
-0.55%
jan 1, 2007
98.301
+0.13
0.13%
jan 1, 2008
98.129
-0.173
-0.18%
jan 1, 2009
98.247
+0.118
0.12%
jan 1, 2010
97.933
-0.314
-0.32%
jan 1, 2011
97.688
-0.245
-0.25%
jan 1, 2012
97.701
+0.013
0.01%
jan 1, 2013
97.613
-0.089
-0.09%
jan 1, 2014
97.429
-0.183
-0.19%
Ranking of countries by current statistics by years


Comments: