29
/
en
AIzaSyAYiBZKx7MnpbEhh9jyipgxe19OcubqV5w
April 1, 2024
41444
Latin America & Caribbean
LCN
false
2
1
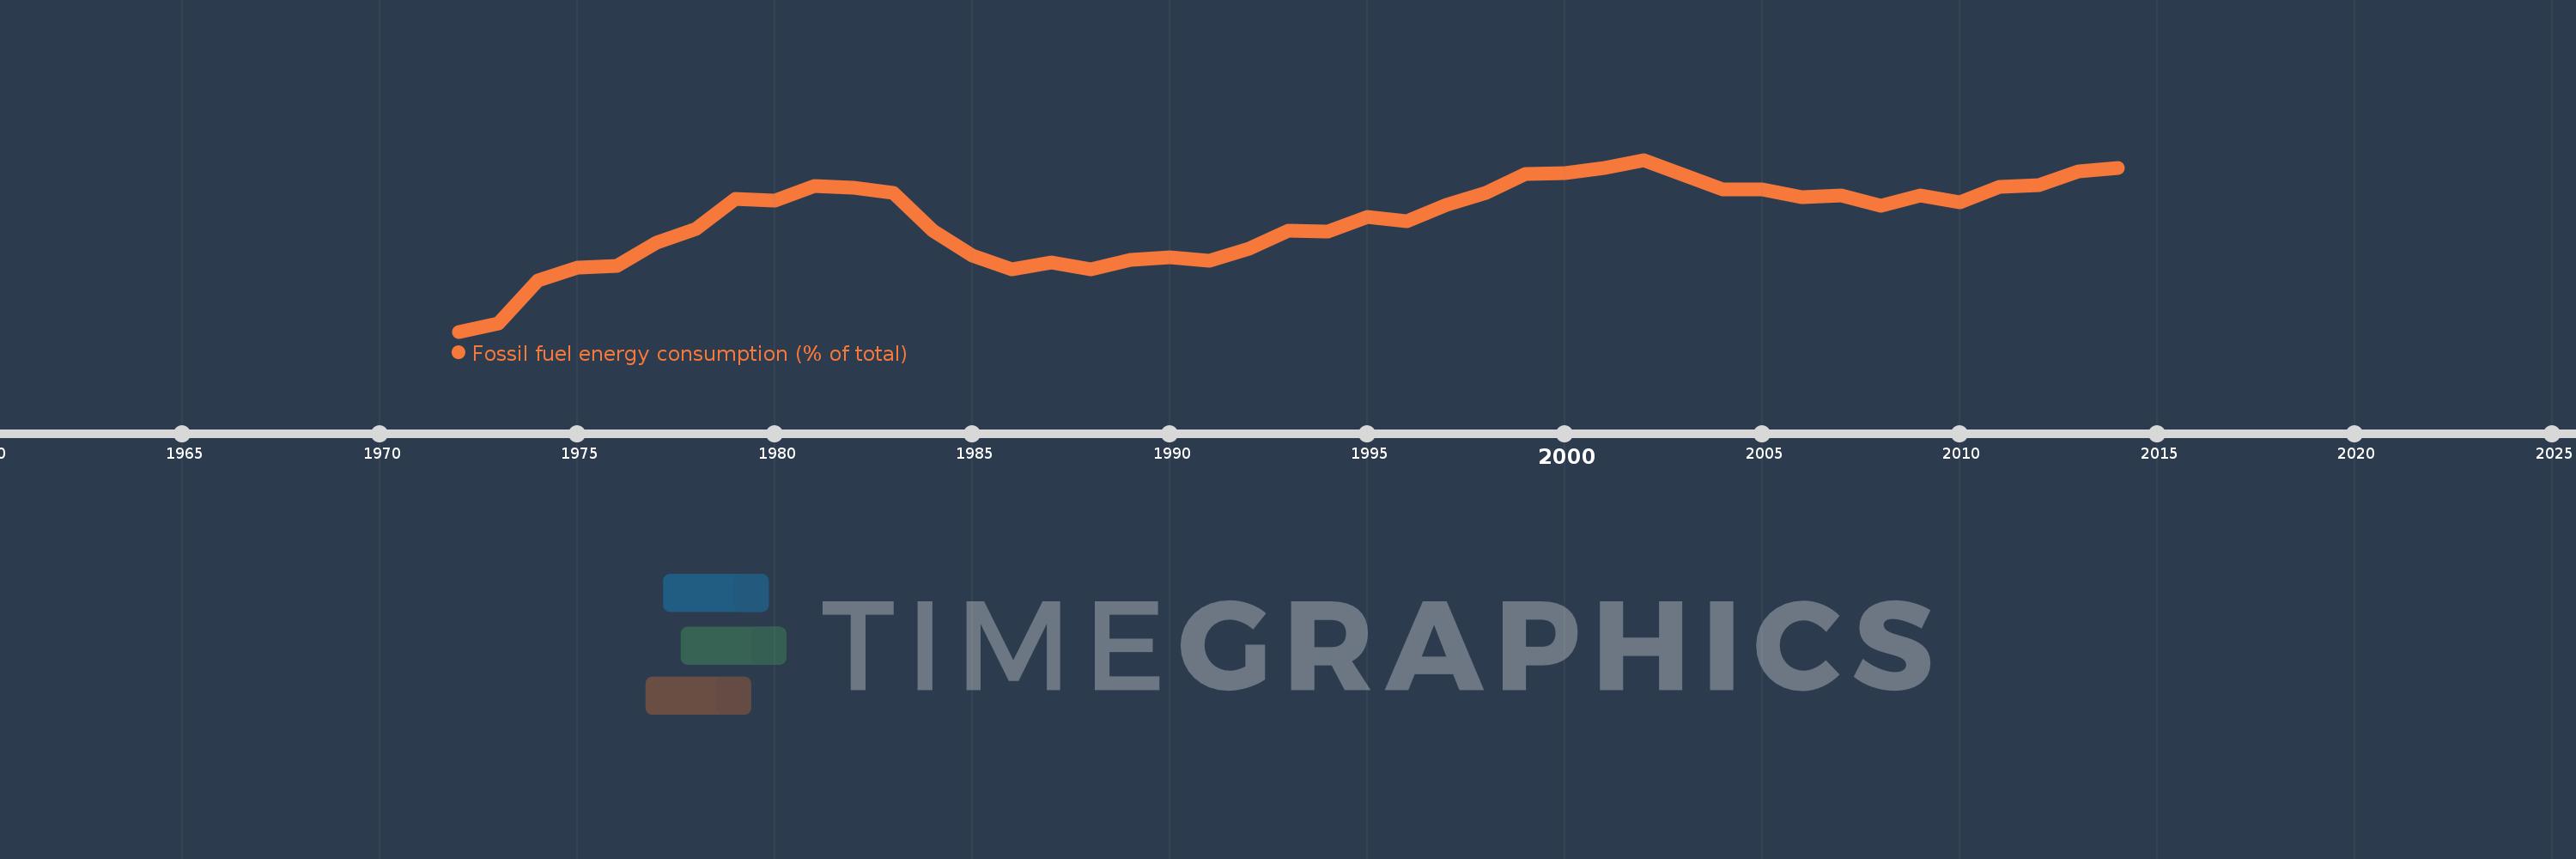
Fossil fuel energy consumption (% of total)
2014,2013,2012,2011,2010,2009,2008,2007,2006,2005,2004,2003,2002,2001,2000,1999,1998,1997,1996,1995,1994,1993,1992,1991,1990,1989,1988,1987,1986,1985,1984,1983,1982,1981,1980,1979,1978,1977,1976,1975,1974,1973,1972
This statistics in other country:
AlbaniaAlgeriaAngolaAntigua and BarbudaArab WorldArgentinaArmeniaAustraliaAustriaAzerbaijanBahamas, TheBahrainBangladeshBarbadosBelarusBelgiumBelizeBeninBhutanBoliviaBosnia and HerzegovinaBotswanaBrazilBrunei DarussalamBulgariaCabo VerdeCambodiaCameroonCanadaCaribbean small statesCentral Europe and the BalticsChileChinaColombiaComorosCongo, Dem. Rep.Congo, Rep.Costa RicaCote d'IvoireCroatiaCubaCuracaoCyprusCzech RepublicDenmarkDjiboutiDominicaDominican RepublicEarly-demographic dividendEast Asia & PacificEast Asia & Pacific (excluding high income)East Asia & Pacific (IDA & IBRD countries)EcuadorEgypt, Arab Rep.El SalvadorEquatorial GuineaEritreaEstoniaEthiopiaEuro areaEurope & Central AsiaEurope & Central Asia (excluding high income)Europe & Central Asia (IDA & IBRD countries)European UnionFijiFinlandFragile and conflict affected situationsFranceGabonGambia, TheGeorgiaGermanyGhanaGibraltarGreeceGrenadaGuatemalaGuinea-BissauGuyanaHaitiHeavily indebted poor countries (HIPC)High incomeHondurasHong Kong SAR, ChinaHungaryIBRD onlyIcelandIDA & IBRD totalIDA blendIDA onlyIDA totalIndiaIndonesiaIran, Islamic Rep.IraqIrelandIsraelItalyJamaicaJapanJordanKazakhstanKenyaKiribatiKorea, Dem. People’s Rep.Korea, Rep.KosovoKuwaitKyrgyz RepublicLate-demographic dividendLatin America & Caribbean Latin America & Caribbean (excluding high income)Latin America & the Caribbean (IDA & IBRD countries)LatviaLeast developed countries: UN classificationLebanonLesothoLibyaLithuaniaLow & middle incomeLow incomeLower middle incomeLuxembourgMacedonia, FYRMalaysiaMaldivesMaltaMarshall IslandsMauritiusMexicoMiddle East & North AfricaMiddle East & North Africa (excluding high income)Middle East & North Africa (IDA & IBRD countries)Middle incomeMoldovaMongoliaMontenegroMoroccoMozambiqueMyanmarNamibiaNepalNetherlandsNew ZealandNicaraguaNigerNigeriaNorth AmericaNorwayOECD membersOmanOther small statesPacific island small statesPakistanPalauPanamaParaguayPeruPhilippinesPolandPortugalPost-demographic dividendPre-demographic dividendQatarRomaniaRussian FederationSamoaSao Tome and PrincipeSaudi ArabiaSenegalSerbiaSeychellesSingaporeSlovak RepublicSloveniaSmall statesSolomon IslandsSouth AfricaSouth AsiaSouth Asia (IDA & IBRD)South SudanSpainSri LankaSt. Kitts and NevisSt. LuciaSt. Vincent and the GrenadinesSub-Saharan Africa Sub-Saharan Africa (excluding high income)Sub-Saharan Africa (IDA & IBRD countries)SudanSurinameSwazilandSwedenSwitzerlandSyrian Arab RepublicTajikistanTanzaniaThailandTimor-LesteTogoTongaTrinidad and TobagoTunisiaTurkeyUkraineUnited Arab EmiratesUnited KingdomUnited StatesUpper middle incomeUruguayUzbekistanVanuatuVenezuela, RBVietnamWorldYemen, Rep.ZambiaZimbabwe Timeline:
This timeline shows a graph from 1972 to 2014 of Latin America & Caribbean . No data until 1971. Number of actual observations by date: 43.
Source name:
World Development Indicators
Source organization:
IEA Statistics © OECD/IEA 2014 (http://www.iea.org/stats/index.asp), subject to https://www.iea.org/t&c/termsandconditions/
Categories, topics:
Energy & Mining
Last updated:
apr 23, 2017
Indicators value changes by year
Minimum:
67.885
jan 1, 1972
At the date of observation
Value
Absolute change
Change from previous value
jan 1, 1972
67.885
+67.885
0.0%
jan 1, 1973
68.195
+0.31
0.46%
jan 1, 1974
69.884
+1.689
2.48%
jan 1, 1975
70.374
+0.49
0.7%
jan 1, 1976
70.442
+0.068
0.1%
jan 1, 1977
71.338
+0.896
1.27%
jan 1, 1978
71.877
+0.539
0.75%
jan 1, 1979
73.053
+1.176
1.64%
jan 1, 1980
72.981
-0.072
-0.1%
jan 1, 1981
73.564
+0.583
0.8%
jan 1, 1982
73.499
-0.065
-0.09%
jan 1, 1983
73.293
-0.206
-0.28%
jan 1, 1984
71.821
-1.472
-2.01%
jan 1, 1985
70.827
-0.994
-1.38%
jan 1, 1986
70.325
-0.502
-0.71%
jan 1, 1987
70.578
+0.253
0.36%
jan 1, 1988
70.293
-0.285
-0.4%
jan 1, 1989
70.688
+0.395
0.56%
jan 1, 1990
70.792
+0.105
0.15%
jan 1, 1991
70.635
-0.157
-0.22%
jan 1, 1992
71.125
+0.49
0.69%
jan 1, 1993
71.827
+0.701
0.99%
jan 1, 1994
71.768
-0.059
-0.08%
jan 1, 1995
72.352
+0.584
0.81%
jan 1, 1996
72.195
-0.158
-0.22%
jan 1, 1997
72.813
+0.618
0.86%
jan 1, 1998
73.267
+0.454
0.62%
jan 1, 1999
74.022
+0.756
1.03%
jan 1, 2000
74.04
+0.017
0.02%
jan 1, 2001
74.266
+0.226
0.31%
jan 1, 2002
74.57
+0.305
0.41%
jan 1, 2003
74.0
-0.57
-0.76%
jan 1, 2004
73.413
-0.587
-0.79%
jan 1, 2005
73.422
+0.009
0.01%
jan 1, 2006
73.116
-0.306
-0.42%
jan 1, 2007
73.191
+0.075
0.1%
jan 1, 2008
72.777
-0.414
-0.57%
jan 1, 2009
73.177
+0.4
0.55%
jan 1, 2010
72.931
-0.247
-0.34%
jan 1, 2011
73.503
+0.572
0.78%
jan 1, 2012
73.579
+0.077
0.1%
jan 1, 2013
74.125
+0.546
0.74%
jan 1, 2014
74.24
+0.115
0.16%
Ranking of countries by current statistics by years


Comments: