29
/
en
AIzaSyAYiBZKx7MnpbEhh9jyipgxe19OcubqV5w
April 1, 2024
151564
Hong Kong SAR, China
HKG
true
2
1
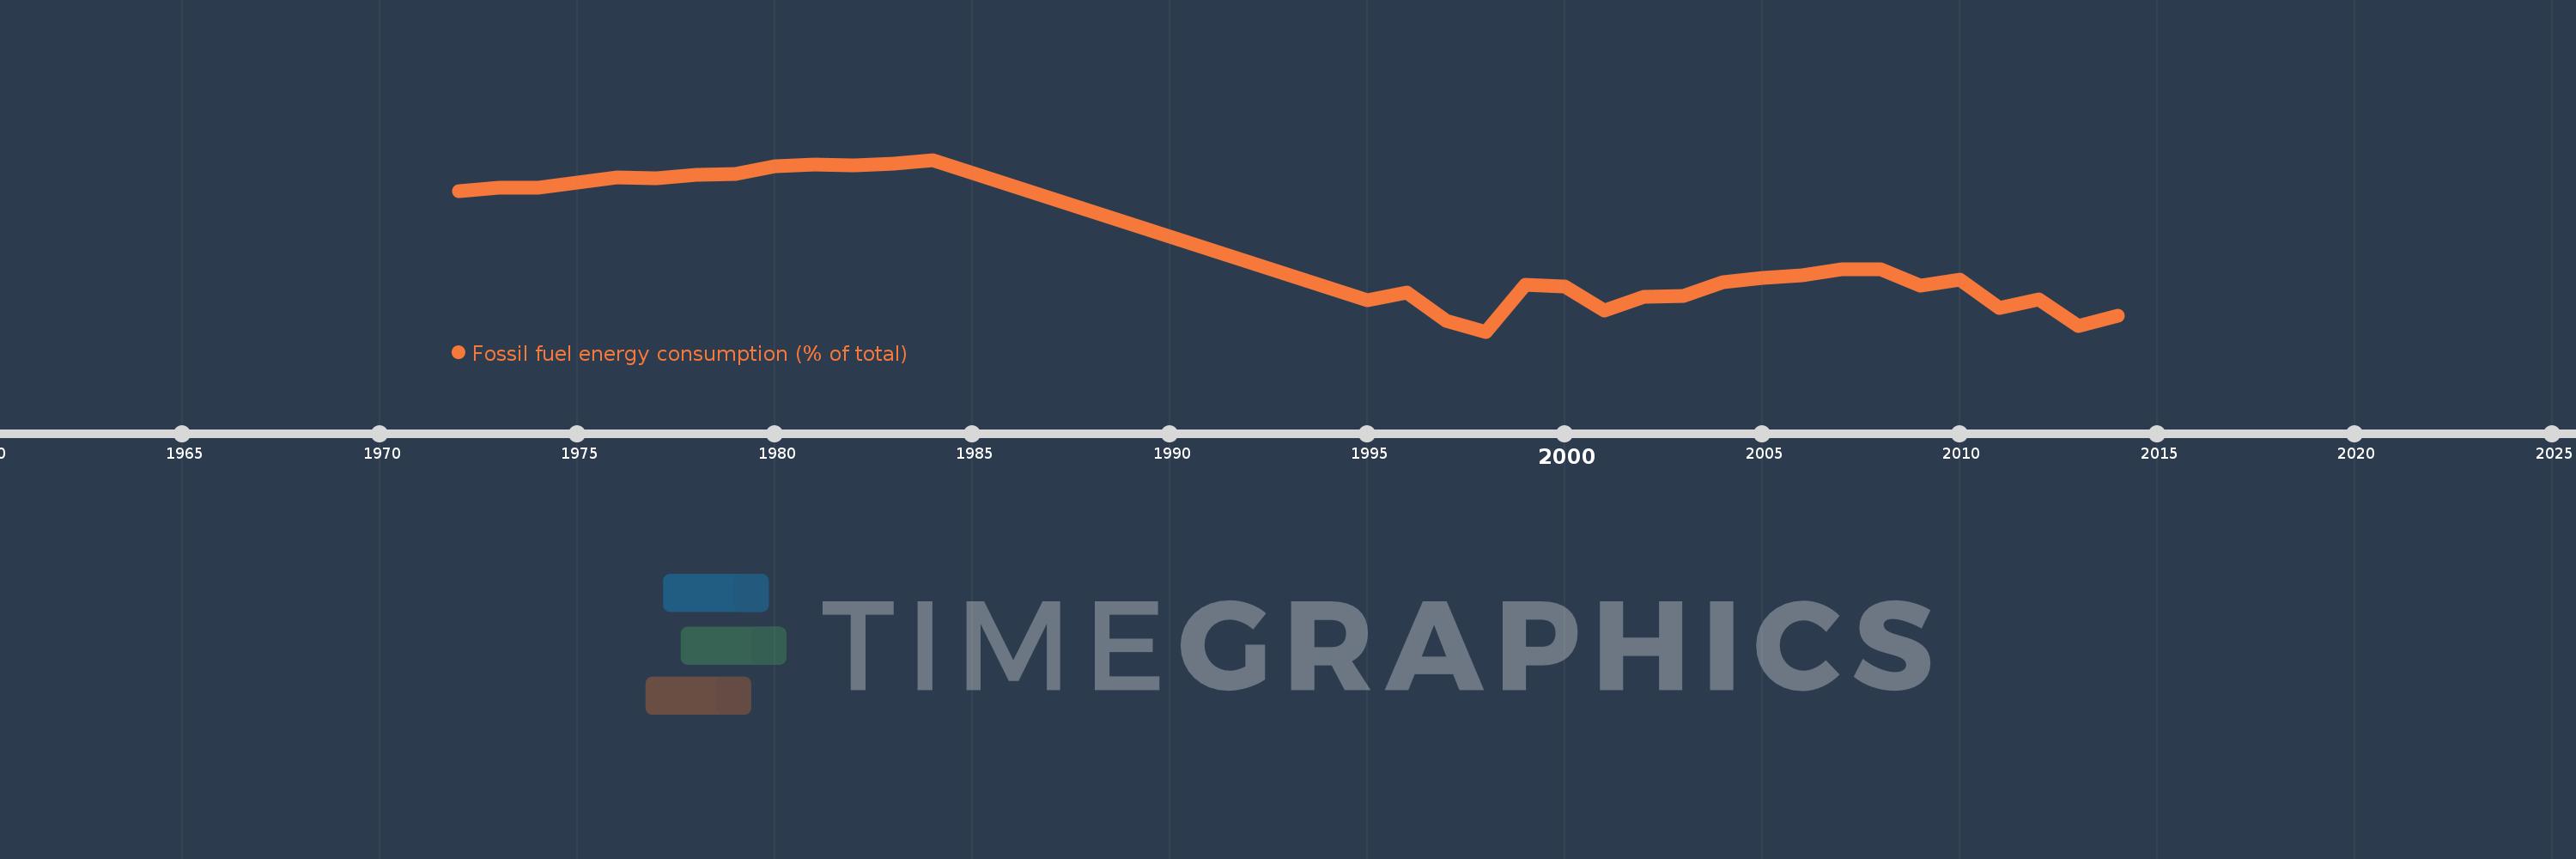
Fossil fuel energy consumption (% of total)
2014,2013,2012,2011,2010,2009,2008,2007,2006,2005,2004,2003,2002,2001,2000,1999,1998,1997,1996,1995,1984,1983,1982,1981,1980,1979,1978,1977,1976,1975,1974,1973,1972
This statistics in other country:
AlbaniaAlgeriaAngolaAntigua and BarbudaArab WorldArgentinaArmeniaAustraliaAustriaAzerbaijanBahamas, TheBahrainBangladeshBarbadosBelarusBelgiumBelizeBeninBhutanBoliviaBosnia and HerzegovinaBotswanaBrazilBrunei DarussalamBulgariaCabo VerdeCambodiaCameroonCanadaCaribbean small statesCentral Europe and the BalticsChileChinaColombiaComorosCongo, Dem. Rep.Congo, Rep.Costa RicaCote d'IvoireCroatiaCubaCuracaoCyprusCzech RepublicDenmarkDjiboutiDominicaDominican RepublicEarly-demographic dividendEast Asia & PacificEast Asia & Pacific (excluding high income)East Asia & Pacific (IDA & IBRD countries)EcuadorEgypt, Arab Rep.El SalvadorEquatorial GuineaEritreaEstoniaEthiopiaEuro areaEurope & Central AsiaEurope & Central Asia (excluding high income)Europe & Central Asia (IDA & IBRD countries)European UnionFijiFinlandFragile and conflict affected situationsFranceGabonGambia, TheGeorgiaGermanyGhanaGibraltarGreeceGrenadaGuatemalaGuinea-BissauGuyanaHaitiHeavily indebted poor countries (HIPC)High incomeHondurasHong Kong SAR, ChinaHungaryIBRD onlyIcelandIDA & IBRD totalIDA blendIDA onlyIDA totalIndiaIndonesiaIran, Islamic Rep.IraqIrelandIsraelItalyJamaicaJapanJordanKazakhstanKenyaKiribatiKorea, Dem. People’s Rep.Korea, Rep.KosovoKuwaitKyrgyz RepublicLate-demographic dividendLatin America & Caribbean Latin America & Caribbean (excluding high income)Latin America & the Caribbean (IDA & IBRD countries)LatviaLeast developed countries: UN classificationLebanonLesothoLibyaLithuaniaLow & middle incomeLow incomeLower middle incomeLuxembourgMacedonia, FYRMalaysiaMaldivesMaltaMarshall IslandsMauritiusMexicoMiddle East & North AfricaMiddle East & North Africa (excluding high income)Middle East & North Africa (IDA & IBRD countries)Middle incomeMoldovaMongoliaMontenegroMoroccoMozambiqueMyanmarNamibiaNepalNetherlandsNew ZealandNicaraguaNigerNigeriaNorth AmericaNorwayOECD membersOmanOther small statesPacific island small statesPakistanPalauPanamaParaguayPeruPhilippinesPolandPortugalPost-demographic dividendPre-demographic dividendQatarRomaniaRussian FederationSamoaSao Tome and PrincipeSaudi ArabiaSenegalSerbiaSeychellesSingaporeSlovak RepublicSloveniaSmall statesSolomon IslandsSouth AfricaSouth AsiaSouth Asia (IDA & IBRD)South SudanSpainSri LankaSt. Kitts and NevisSt. LuciaSt. Vincent and the GrenadinesSub-Saharan Africa Sub-Saharan Africa (excluding high income)Sub-Saharan Africa (IDA & IBRD countries)SudanSurinameSwazilandSwedenSwitzerlandSyrian Arab RepublicTajikistanTanzaniaThailandTimor-LesteTogoTongaTrinidad and TobagoTunisiaTurkeyUkraineUnited Arab EmiratesUnited KingdomUnited StatesUpper middle incomeUruguayUzbekistanVanuatuVenezuela, RBVietnamWorldYemen, Rep.ZambiaZimbabwe Timeline:
This timeline shows a graph from 1972 to 2014 of Hong Kong SAR, China. No data until 1971. Number of actual observations by date: 33.
Source name:
World Development Indicators
Source organization:
IEA Statistics © OECD/IEA 2014 (http://www.iea.org/stats/index.asp), subject to https://www.iea.org/t&c/termsandconditions/
Categories, topics:
Energy & Mining
Last updated:
apr 23, 2017
Indicators value changes by year
Minimum:
93.087
jan 1, 1998
Maximum:
99.583
jan 1, 1984
At the date of observation
Value
Absolute change
Change from previous value
jan 1, 1972
98.382
+98.382
0.0%
jan 1, 1973
98.524
+0.142
0.14%
jan 1, 1974
98.532
+0.008
0.01%
jan 1, 1975
98.708
+0.176
0.18%
jan 1, 1976
98.906
+0.198
0.2%
jan 1, 1977
98.884
-0.022
-0.02%
jan 1, 1978
99.013
+0.129
0.13%
jan 1, 1979
99.043
+0.029
0.03%
jan 1, 1980
99.346
+0.303
0.31%
jan 1, 1981
99.418
+0.072
0.07%
jan 1, 1982
99.367
-0.051
-0.05%
jan 1, 1983
99.431
+0.064
0.06%
jan 1, 1984
99.583
+0.152
0.15%
jan 1, 1995
94.278
-5.305
-5.33%
jan 1, 1996
94.575
+0.297
0.31%
jan 1, 1997
93.506
-1.069
-1.13%
jan 1, 1998
93.087
-0.419
-0.45%
jan 1, 1999
94.844
+1.757
1.89%
jan 1, 2000
94.786
-0.058
-0.06%
jan 1, 2001
93.875
-0.911
-0.96%
jan 1, 2002
94.399
+0.524
0.56%
jan 1, 2003
94.427
+0.028
0.03%
jan 1, 2004
94.959
+0.532
0.56%
jan 1, 2005
95.101
+0.142
0.15%
jan 1, 2006
95.209
+0.108
0.11%
jan 1, 2007
95.445
+0.236
0.25%
jan 1, 2008
95.452
+0.008
0.01%
jan 1, 2009
94.835
-0.617
-0.65%
jan 1, 2010
95.058
+0.224
0.24%
jan 1, 2011
93.972
-1.086
-1.14%
jan 1, 2012
94.315
+0.343
0.36%
jan 1, 2013
93.283
-1.032
-1.09%
jan 1, 2014
93.699
+0.416
0.45%
Ranking of countries by current statistics by years


Comments: