29
/
en
AIzaSyAYiBZKx7MnpbEhh9jyipgxe19OcubqV5w
April 1, 2024
269317
Turkey
TUR
true
2
1
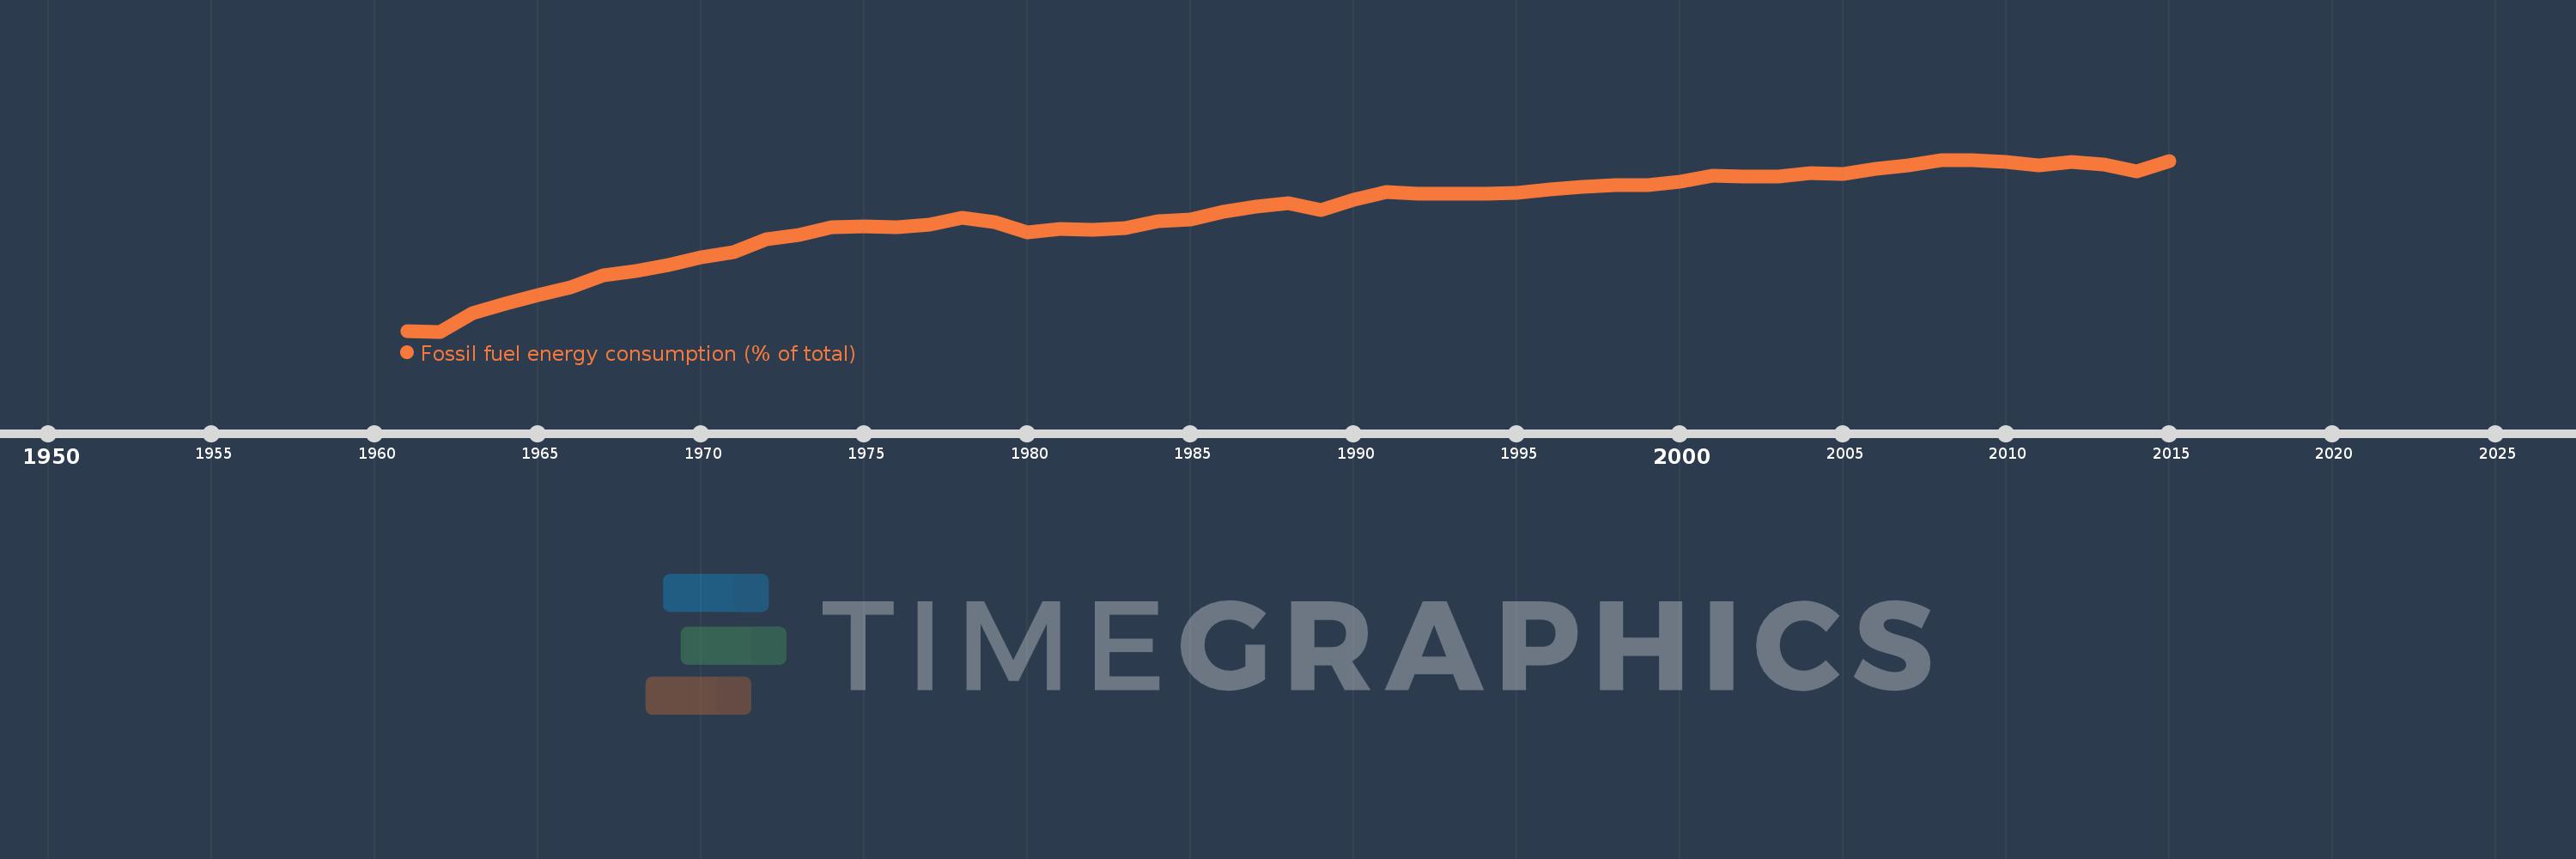
Fossil fuel energy consumption (% of total)
2015,2014,2013,2012,2011,2010,2009,2008,2007,2006,2005,2004,2003,2002,2001,2000,1999,1998,1997,1996,1995,1994,1993,1992,1991,1990,1989,1988,1987,1986,1985,1984,1983,1982,1981,1980,1979,1978,1977,1976,1975,1974,1973,1972,1971,1970,1969,1968,1967,1966,1965,1964,1963,1962,1961
This statistics in other country:
AlbaniaAlgeriaAngolaAntigua and BarbudaArab WorldArgentinaArmeniaAustraliaAustriaAzerbaijanBahamas, TheBahrainBangladeshBarbadosBelarusBelgiumBelizeBeninBhutanBoliviaBosnia and HerzegovinaBotswanaBrazilBrunei DarussalamBulgariaCabo VerdeCambodiaCameroonCanadaCaribbean small statesCentral Europe and the BalticsChileChinaColombiaComorosCongo, Dem. Rep.Congo, Rep.Costa RicaCote d'IvoireCroatiaCubaCuracaoCyprusCzech RepublicDenmarkDjiboutiDominicaDominican RepublicEarly-demographic dividendEast Asia & PacificEast Asia & Pacific (excluding high income)East Asia & Pacific (IDA & IBRD countries)EcuadorEgypt, Arab Rep.El SalvadorEquatorial GuineaEritreaEstoniaEthiopiaEuro areaEurope & Central AsiaEurope & Central Asia (excluding high income)Europe & Central Asia (IDA & IBRD countries)European UnionFijiFinlandFragile and conflict affected situationsFranceGabonGambia, TheGeorgiaGermanyGhanaGibraltarGreeceGrenadaGuatemalaGuinea-BissauGuyanaHaitiHeavily indebted poor countries (HIPC)High incomeHondurasHong Kong SAR, ChinaHungaryIBRD onlyIcelandIDA & IBRD totalIDA blendIDA onlyIDA totalIndiaIndonesiaIran, Islamic Rep.IraqIrelandIsraelItalyJamaicaJapanJordanKazakhstanKenyaKiribatiKorea, Dem. People’s Rep.Korea, Rep.KosovoKuwaitKyrgyz RepublicLate-demographic dividendLatin America & Caribbean Latin America & Caribbean (excluding high income)Latin America & the Caribbean (IDA & IBRD countries)LatviaLeast developed countries: UN classificationLebanonLesothoLibyaLithuaniaLow & middle incomeLow incomeLower middle incomeLuxembourgMacedonia, FYRMalaysiaMaldivesMaltaMarshall IslandsMauritiusMexicoMiddle East & North AfricaMiddle East & North Africa (excluding high income)Middle East & North Africa (IDA & IBRD countries)Middle incomeMoldovaMongoliaMontenegroMoroccoMozambiqueMyanmarNamibiaNepalNetherlandsNew ZealandNicaraguaNigerNigeriaNorth AmericaNorwayOECD membersOmanOther small statesPacific island small statesPakistanPalauPanamaParaguayPeruPhilippinesPolandPortugalPost-demographic dividendPre-demographic dividendQatarRomaniaRussian FederationSamoaSao Tome and PrincipeSaudi ArabiaSenegalSerbiaSeychellesSingaporeSlovak RepublicSloveniaSmall statesSolomon IslandsSouth AfricaSouth AsiaSouth Asia (IDA & IBRD)South SudanSpainSri LankaSt. Kitts and NevisSt. LuciaSt. Vincent and the GrenadinesSub-Saharan Africa Sub-Saharan Africa (excluding high income)Sub-Saharan Africa (IDA & IBRD countries)SudanSurinameSwazilandSwedenSwitzerlandSyrian Arab RepublicTajikistanTanzaniaThailandTimor-LesteTogoTongaTrinidad and TobagoTunisiaTurkeyUkraineUnited Arab EmiratesUnited KingdomUnited StatesUpper middle incomeUruguayUzbekistanVanuatuVenezuela, RBVietnamWorldYemen, Rep.ZambiaZimbabwe Timeline:
This timeline shows a graph from 1961 to 2015 of Turkey. No data until 1960. Number of actual observations by date: 55.
Source name:
World Development Indicators
Source organization:
IEA Statistics © OECD/IEA 2014 (http://www.iea.org/stats/index.asp), subject to https://www.iea.org/t&c/termsandconditions/
Categories, topics:
Energy & Mining
Last updated:
apr 23, 2017
Indicators value changes by year
Minimum:
44.159
jan 1, 1962
Maximum:
90.574
jan 1, 2009
At the date of observation
Value
Absolute change
Change from previous value
jan 1, 1961
44.199
+44.199
0.0%
jan 1, 1962
44.159
-0.04
-0.09%
jan 1, 1963
49.05
+4.891
11.07%
jan 1, 1964
51.626
+2.577
5.25%
jan 1, 1965
53.975
+2.349
4.55%
jan 1, 1966
56.082
+2.107
3.9%
jan 1, 1967
59.449
+3.367
6.0%
jan 1, 1968
60.625
+1.175
1.98%
jan 1, 1969
62.183
+1.559
2.57%
jan 1, 1970
64.161
+1.978
3.18%
jan 1, 1971
65.654
+1.493
2.33%
jan 1, 1972
68.992
+3.338
5.08%
jan 1, 1973
70.281
+1.29
1.87%
jan 1, 1974
72.391
+2.11
3.0%
jan 1, 1975
72.572
+0.181
0.25%
jan 1, 1976
72.376
-0.196
-0.27%
jan 1, 1977
73.105
+0.729
1.01%
jan 1, 1978
74.851
+1.746
2.39%
jan 1, 1979
73.697
-1.153
-1.54%
jan 1, 1980
70.989
-2.709
-3.68%
jan 1, 1981
71.918
+0.929
1.31%
jan 1, 1982
71.596
-0.322
-0.45%
jan 1, 1983
72.172
+0.577
0.81%
jan 1, 1984
73.876
+1.704
2.36%
jan 1, 1985
74.381
+0.504
0.68%
jan 1, 1986
76.592
+2.212
2.97%
jan 1, 1987
77.982
+1.39
1.81%
jan 1, 1988
78.867
+0.884
1.13%
jan 1, 1989
77.036
-1.83
-2.32%
jan 1, 1990
79.783
+2.747
3.57%
jan 1, 1991
81.801
+2.018
2.53%
jan 1, 1992
81.419
-0.382
-0.47%
jan 1, 1993
81.374
-0.045
-0.05%
jan 1, 1994
81.388
+0.014
0.02%
jan 1, 1995
81.617
+0.228
0.28%
jan 1, 1996
82.596
+0.979
1.2%
jan 1, 1997
83.236
+0.64
0.77%
jan 1, 1998
83.783
+0.547
0.66%
jan 1, 1999
83.643
-0.14
-0.17%
jan 1, 2000
84.563
+0.92
1.1%
jan 1, 2001
86.301
+1.739
2.06%
jan 1, 2002
86.124
-0.177
-0.21%
jan 1, 2003
86.089
-0.035
-0.04%
jan 1, 2004
87.057
+0.969
1.13%
jan 1, 2005
86.706
-0.351
-0.4%
jan 1, 2006
88.06
+1.354
1.56%
jan 1, 2007
89.004
+0.944
1.07%
jan 1, 2008
90.497
+1.493
1.68%
jan 1, 2009
90.574
+0.077
0.09%
jan 1, 2010
89.899
-0.674
-0.74%
jan 1, 2011
88.985
-0.914
-1.02%
jan 1, 2012
89.897
+0.912
1.02%
jan 1, 2013
89.359
-0.538
-0.6%
jan 1, 2014
87.353
-2.007
-2.25%
jan 1, 2015
90.166
+2.813
3.22%
Ranking of countries by current statistics by years


Comments: