29
/
en
AIzaSyAYiBZKx7MnpbEhh9jyipgxe19OcubqV5w
April 1, 2024
187779
Malaysia
MYS
true
2
1
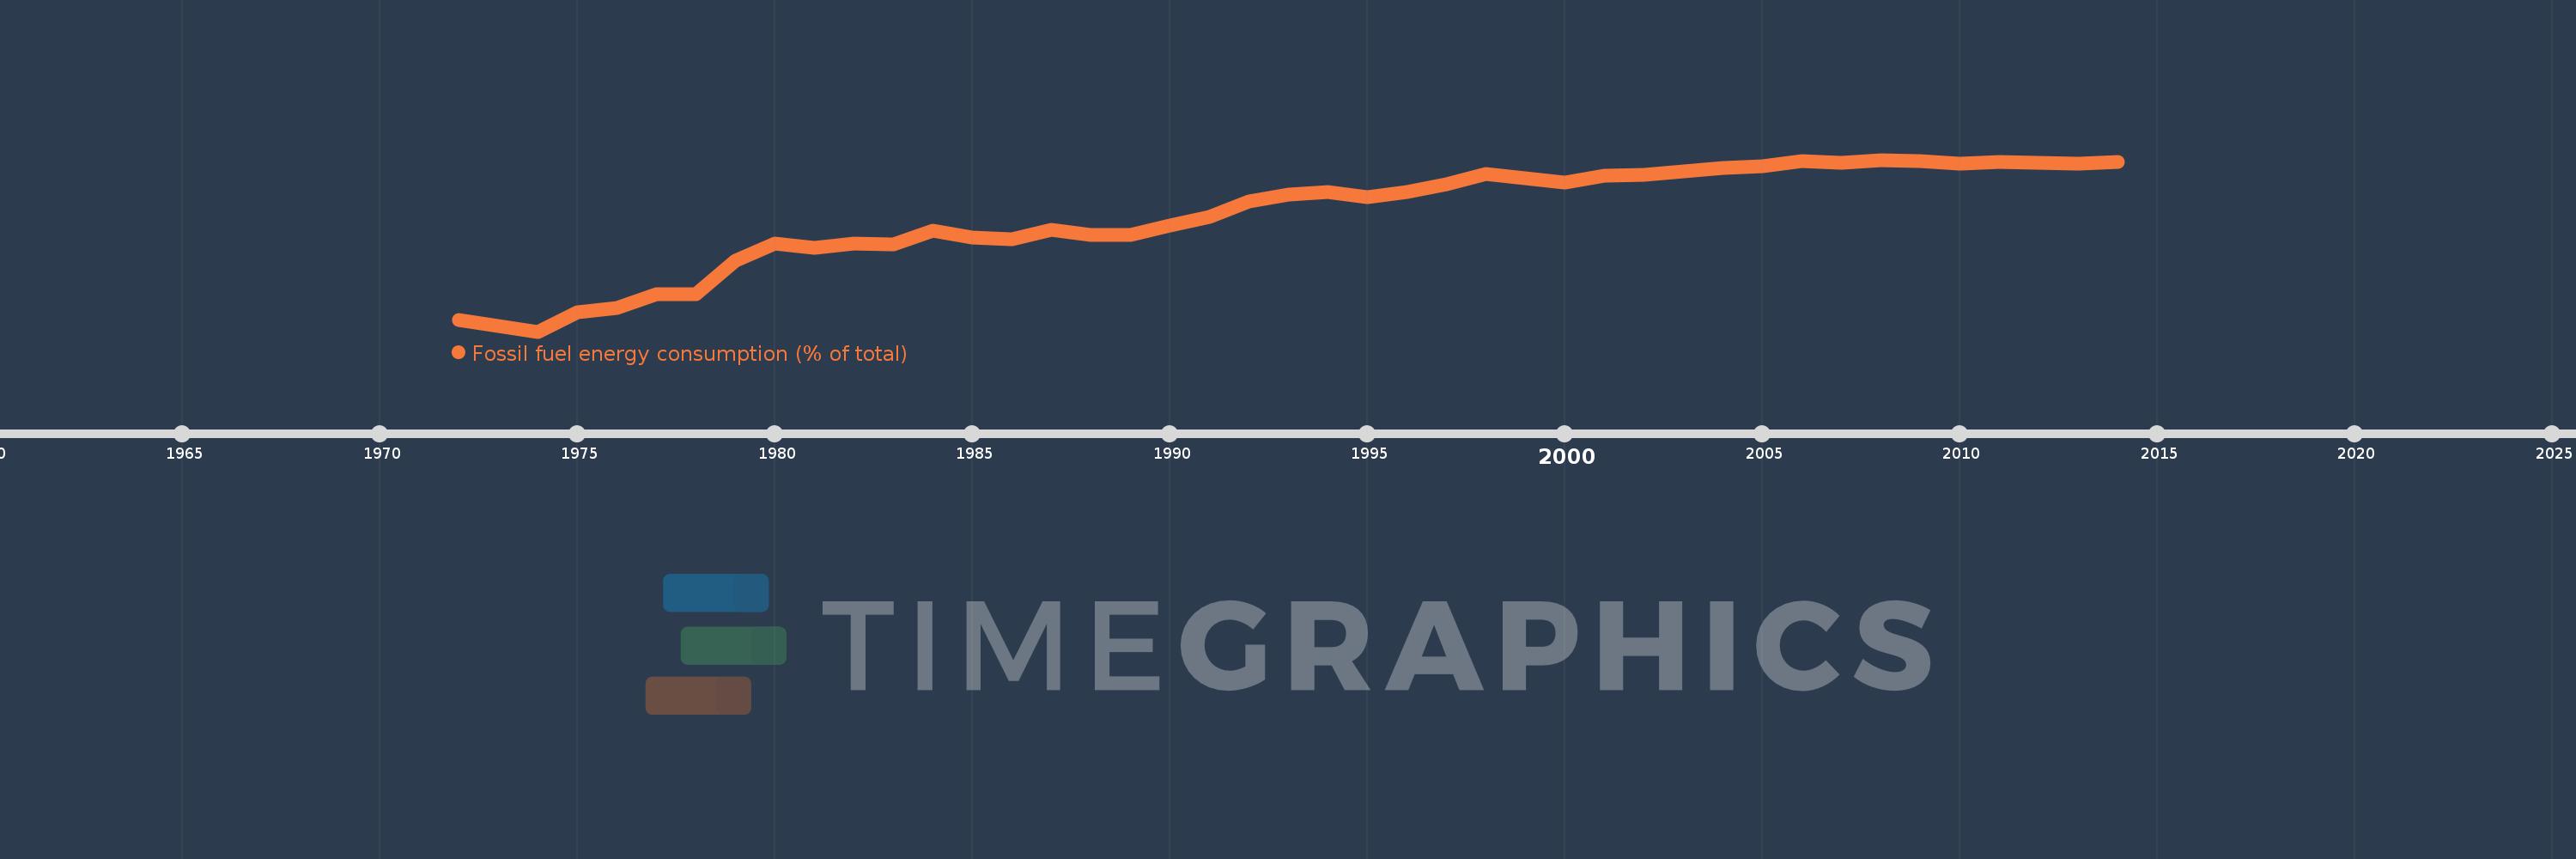
Fossil fuel energy consumption (% of total)
2014,2013,2012,2011,2010,2009,2008,2007,2006,2005,2004,2003,2002,2001,2000,1999,1998,1997,1996,1995,1994,1993,1992,1991,1990,1989,1988,1987,1986,1985,1984,1983,1982,1981,1980,1979,1978,1977,1976,1975,1974,1973,1972
This statistics in other country:
AlbaniaAlgeriaAngolaAntigua and BarbudaArab WorldArgentinaArmeniaAustraliaAustriaAzerbaijanBahamas, TheBahrainBangladeshBarbadosBelarusBelgiumBelizeBeninBhutanBoliviaBosnia and HerzegovinaBotswanaBrazilBrunei DarussalamBulgariaCabo VerdeCambodiaCameroonCanadaCaribbean small statesCentral Europe and the BalticsChileChinaColombiaComorosCongo, Dem. Rep.Congo, Rep.Costa RicaCote d'IvoireCroatiaCubaCuracaoCyprusCzech RepublicDenmarkDjiboutiDominicaDominican RepublicEarly-demographic dividendEast Asia & PacificEast Asia & Pacific (excluding high income)East Asia & Pacific (IDA & IBRD countries)EcuadorEgypt, Arab Rep.El SalvadorEquatorial GuineaEritreaEstoniaEthiopiaEuro areaEurope & Central AsiaEurope & Central Asia (excluding high income)Europe & Central Asia (IDA & IBRD countries)European UnionFijiFinlandFragile and conflict affected situationsFranceGabonGambia, TheGeorgiaGermanyGhanaGibraltarGreeceGrenadaGuatemalaGuinea-BissauGuyanaHaitiHeavily indebted poor countries (HIPC)High incomeHondurasHong Kong SAR, ChinaHungaryIBRD onlyIcelandIDA & IBRD totalIDA blendIDA onlyIDA totalIndiaIndonesiaIran, Islamic Rep.IraqIrelandIsraelItalyJamaicaJapanJordanKazakhstanKenyaKiribatiKorea, Dem. People’s Rep.Korea, Rep.KosovoKuwaitKyrgyz RepublicLate-demographic dividendLatin America & Caribbean Latin America & Caribbean (excluding high income)Latin America & the Caribbean (IDA & IBRD countries)LatviaLeast developed countries: UN classificationLebanonLesothoLibyaLithuaniaLow & middle incomeLow incomeLower middle incomeLuxembourgMacedonia, FYRMalaysiaMaldivesMaltaMarshall IslandsMauritiusMexicoMiddle East & North AfricaMiddle East & North Africa (excluding high income)Middle East & North Africa (IDA & IBRD countries)Middle incomeMoldovaMongoliaMontenegroMoroccoMozambiqueMyanmarNamibiaNepalNetherlandsNew ZealandNicaraguaNigerNigeriaNorth AmericaNorwayOECD membersOmanOther small statesPacific island small statesPakistanPalauPanamaParaguayPeruPhilippinesPolandPortugalPost-demographic dividendPre-demographic dividendQatarRomaniaRussian FederationSamoaSao Tome and PrincipeSaudi ArabiaSenegalSerbiaSeychellesSingaporeSlovak RepublicSloveniaSmall statesSolomon IslandsSouth AfricaSouth AsiaSouth Asia (IDA & IBRD)South SudanSpainSri LankaSt. Kitts and NevisSt. LuciaSt. Vincent and the GrenadinesSub-Saharan Africa Sub-Saharan Africa (excluding high income)Sub-Saharan Africa (IDA & IBRD countries)SudanSurinameSwazilandSwedenSwitzerlandSyrian Arab RepublicTajikistanTanzaniaThailandTimor-LesteTogoTongaTrinidad and TobagoTunisiaTurkeyUkraineUnited Arab EmiratesUnited KingdomUnited StatesUpper middle incomeUruguayUzbekistanVanuatuVenezuela, RBVietnamWorldYemen, Rep.ZambiaZimbabwe Timeline:
This timeline shows a graph from 1972 to 2014 of Malaysia. No data until 1971. Number of actual observations by date: 43.
Source name:
World Development Indicators
Source organization:
IEA Statistics © OECD/IEA 2014 (http://www.iea.org/stats/index.asp), subject to https://www.iea.org/t&c/termsandconditions/
Categories, topics:
Energy & Mining
Last updated:
apr 23, 2017
Indicators value changes by year
Minimum:
73.812
jan 1, 1974
Maximum:
95.117
jan 1, 2008
At the date of observation
Value
Absolute change
Change from previous value
jan 1, 1972
75.243
+75.243
0.0%
jan 1, 1973
74.542
-0.701
-0.93%
jan 1, 1974
73.812
-0.73
-0.98%
jan 1, 1975
76.245
+2.432
3.3%
jan 1, 1976
76.724
+0.479
0.63%
jan 1, 1977
78.406
+1.682
2.19%
jan 1, 1978
78.459
+0.053
0.07%
jan 1, 1979
82.608
+4.149
5.29%
jan 1, 1980
84.696
+2.088
2.53%
jan 1, 1981
84.224
-0.471
-0.56%
jan 1, 1982
84.698
+0.474
0.56%
jan 1, 1983
84.61
-0.088
-0.1%
jan 1, 1984
86.371
+1.761
2.08%
jan 1, 1985
85.458
-0.913
-1.06%
jan 1, 1986
85.221
-0.237
-0.28%
jan 1, 1987
86.425
+1.204
1.41%
jan 1, 1988
85.756
-0.669
-0.77%
jan 1, 1989
85.8
+0.044
0.05%
jan 1, 1990
87.019
+1.219
1.42%
jan 1, 1991
88.004
+0.986
1.13%
jan 1, 1992
89.996
+1.992
2.26%
jan 1, 1993
90.759
+0.763
0.85%
jan 1, 1994
91.117
+0.358
0.39%
jan 1, 1995
90.476
-0.641
-0.7%
jan 1, 1996
91.131
+0.655
0.72%
jan 1, 1997
92.057
+0.926
1.02%
jan 1, 1998
93.39
+1.333
1.45%
jan 1, 1999
92.824
-0.566
-0.61%
jan 1, 2000
92.258
-0.566
-0.61%
jan 1, 2001
93.167
+0.91
0.99%
jan 1, 2002
93.303
+0.135
0.14%
jan 1, 2003
93.703
+0.4
0.43%
jan 1, 2004
94.087
+0.385
0.41%
jan 1, 2005
94.344
+0.257
0.27%
jan 1, 2006
95.005
+0.661
0.7%
jan 1, 2007
94.791
-0.214
-0.23%
jan 1, 2008
95.117
+0.326
0.34%
jan 1, 2009
94.931
-0.186
-0.2%
jan 1, 2010
94.655
-0.276
-0.29%
jan 1, 2011
94.833
+0.179
0.19%
jan 1, 2012
94.748
-0.085
-0.09%
jan 1, 2013
94.632
-0.116
-0.12%
jan 1, 2014
94.802
+0.17
0.18%
Ranking of countries by current statistics by years


Comments: