29
/
en
AIzaSyAYiBZKx7MnpbEhh9jyipgxe19OcubqV5w
April 1, 2024
253013
Sudan
SDN
true
2
1
Fossil fuel energy consumption (% of total)
2014,2013,2012,2011,2010,2009,2008,2007,2006,2005,2004,2003,2002,2001,2000,1999,1998,1997,1996,1995,1994,1993,1992,1991,1990,1989,1988,1987,1986,1985,1984,1983,1982,1981,1980,1979,1978,1977,1976,1975,1974,1973,1972
This statistics in other country:
AlbaniaAlgeriaAngolaAntigua and BarbudaArab WorldArgentinaArmeniaAustraliaAustriaAzerbaijanBahamas, TheBahrainBangladeshBarbadosBelarusBelgiumBelizeBeninBhutanBoliviaBosnia and HerzegovinaBotswanaBrazilBrunei DarussalamBulgariaCabo VerdeCambodiaCameroonCanadaCaribbean small statesCentral Europe and the BalticsChileChinaColombiaComorosCongo, Dem. Rep.Congo, Rep.Costa RicaCote d'IvoireCroatiaCubaCuracaoCyprusCzech RepublicDenmarkDjiboutiDominicaDominican RepublicEarly-demographic dividendEast Asia & PacificEast Asia & Pacific (excluding high income)East Asia & Pacific (IDA & IBRD countries)EcuadorEgypt, Arab Rep.El SalvadorEquatorial GuineaEritreaEstoniaEthiopiaEuro areaEurope & Central AsiaEurope & Central Asia (excluding high income)Europe & Central Asia (IDA & IBRD countries)European UnionFijiFinlandFragile and conflict affected situationsFranceGabonGambia, TheGeorgiaGermanyGhanaGibraltarGreeceGrenadaGuatemalaGuinea-BissauGuyanaHaitiHeavily indebted poor countries (HIPC)High incomeHondurasHong Kong SAR, ChinaHungaryIBRD onlyIcelandIDA & IBRD totalIDA blendIDA onlyIDA totalIndiaIndonesiaIran, Islamic Rep.IraqIrelandIsraelItalyJamaicaJapanJordanKazakhstanKenyaKiribatiKorea, Dem. People’s Rep.Korea, Rep.KosovoKuwaitKyrgyz RepublicLate-demographic dividendLatin America & Caribbean Latin America & Caribbean (excluding high income)Latin America & the Caribbean (IDA & IBRD countries)LatviaLeast developed countries: UN classificationLebanonLesothoLibyaLithuaniaLow & middle incomeLow incomeLower middle incomeLuxembourgMacedonia, FYRMalaysiaMaldivesMaltaMarshall IslandsMauritiusMexicoMiddle East & North AfricaMiddle East & North Africa (excluding high income)Middle East & North Africa (IDA & IBRD countries)Middle incomeMoldovaMongoliaMontenegroMoroccoMozambiqueMyanmarNamibiaNepalNetherlandsNew ZealandNicaraguaNigerNigeriaNorth AmericaNorwayOECD membersOmanOther small statesPacific island small statesPakistanPalauPanamaParaguayPeruPhilippinesPolandPortugalPost-demographic dividendPre-demographic dividendQatarRomaniaRussian FederationSamoaSao Tome and PrincipeSaudi ArabiaSenegalSerbiaSeychellesSingaporeSlovak RepublicSloveniaSmall statesSolomon IslandsSouth AfricaSouth AsiaSouth Asia (IDA & IBRD)South SudanSpainSri LankaSt. Kitts and NevisSt. LuciaSt. Vincent and the GrenadinesSub-Saharan Africa Sub-Saharan Africa (excluding high income)Sub-Saharan Africa (IDA & IBRD countries)SudanSurinameSwazilandSwedenSwitzerlandSyrian Arab RepublicTajikistanTanzaniaThailandTimor-LesteTogoTongaTrinidad and TobagoTunisiaTurkeyUkraineUnited Arab EmiratesUnited KingdomUnited StatesUpper middle incomeUruguayUzbekistanVanuatuVenezuela, RBVietnamWorldYemen, Rep.ZambiaZimbabwe Timeline:
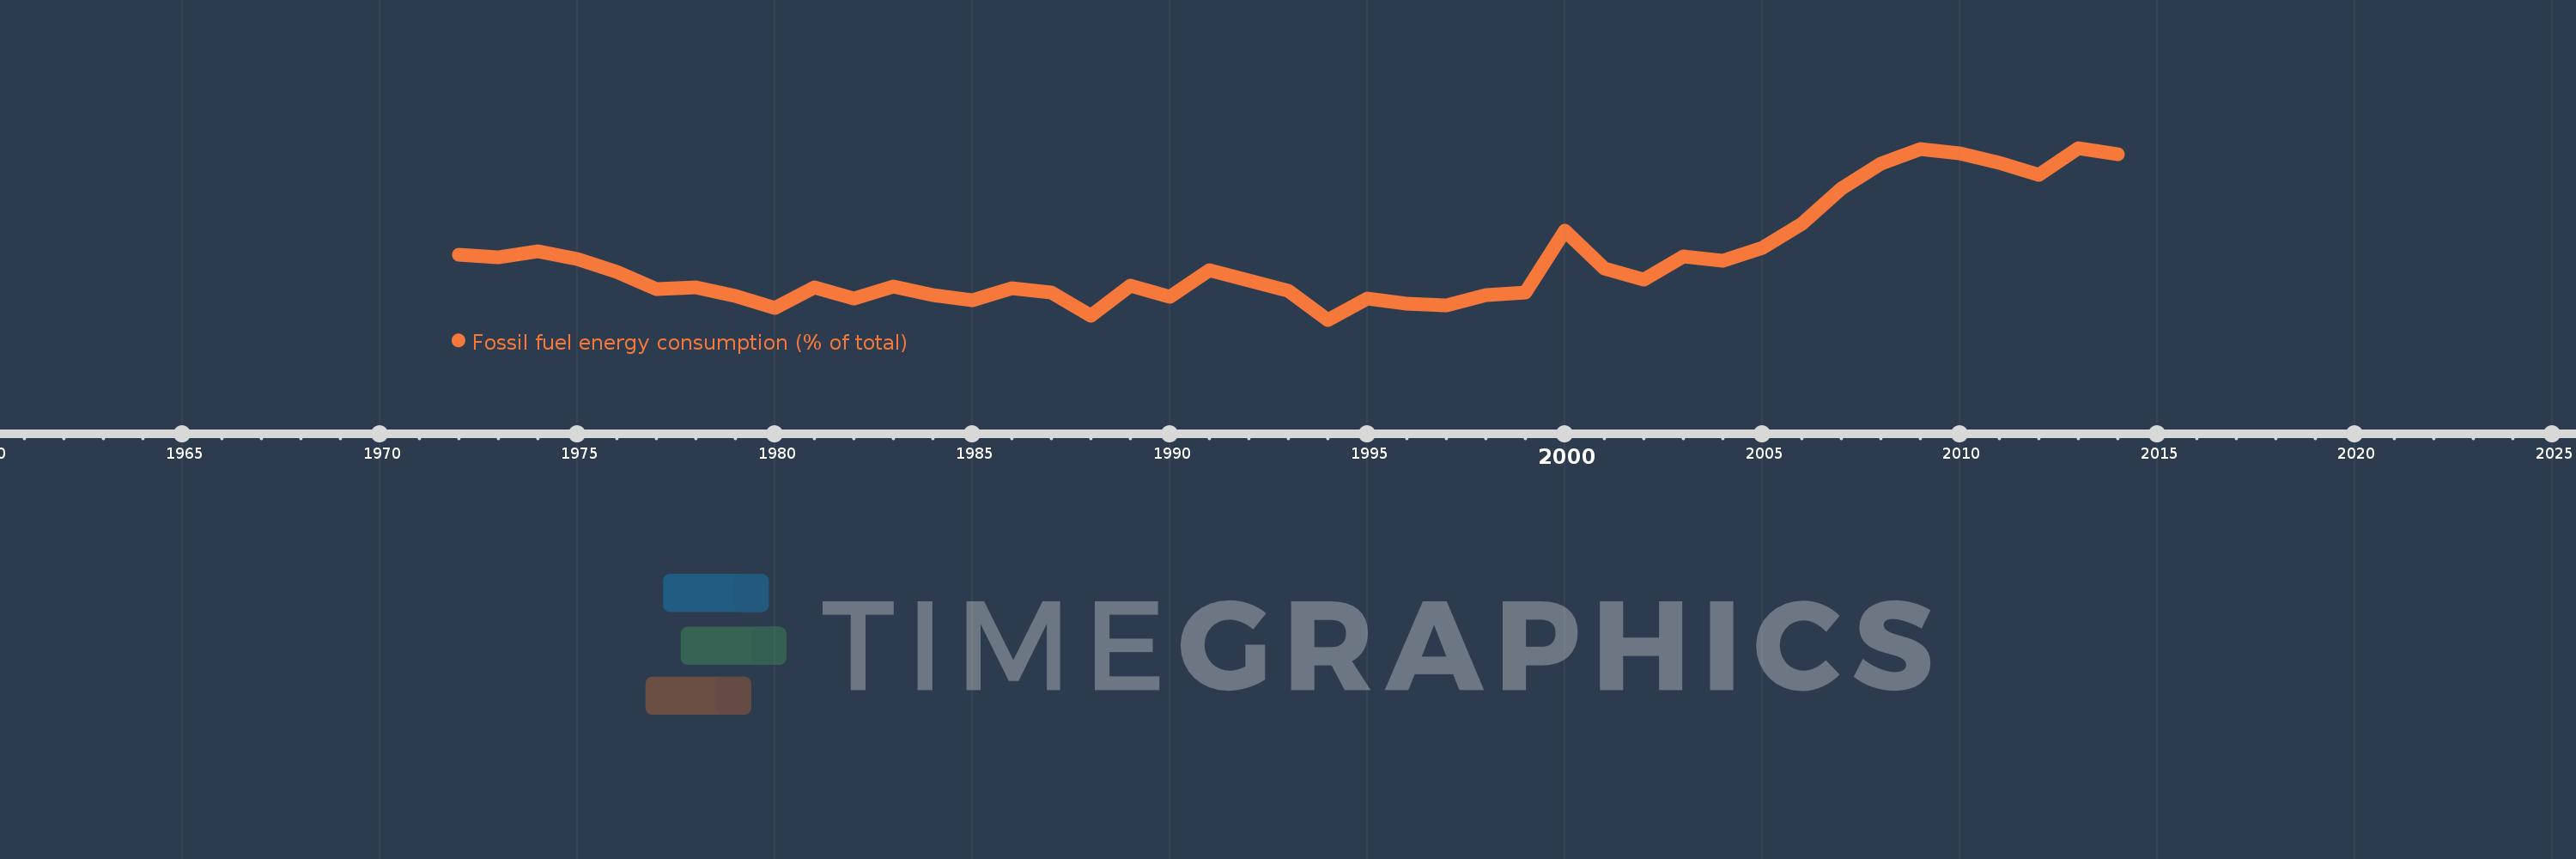
This timeline shows a graph from 1972 to 2014 of Sudan. No data until 1971. Number of actual observations by date: 43.
Source name:
World Development Indicators
Source organization:
IEA Statistics © OECD/IEA 2014 (http://www.iea.org/stats/index.asp), subject to https://www.iea.org/t&c/termsandconditions/
Categories, topics:
Energy & Mining
Last updated:
apr 23, 2017
Indicators value changes by year
Minimum:
11.116
jan 1, 1994
Maximum:
32.899
jan 1, 2013
At the date of observation
Value
Absolute change
Change from previous value
jan 1, 1972
19.355
+19.355
0.0%
jan 1, 1973
19.062
-0.293
-1.51%
jan 1, 1974
19.745
+0.683
3.58%
jan 1, 1975
18.815
-0.93
-4.71%
jan 1, 1976
17.221
-1.594
-8.47%
jan 1, 1977
14.954
-2.267
-13.16%
jan 1, 1978
15.19
+0.236
1.57%
jan 1, 1979
14.14
-1.05
-6.91%
jan 1, 1980
12.572
-1.568
-11.09%
jan 1, 1981
15.256
+2.684
21.35%
jan 1, 1982
13.8
-1.456
-9.55%
jan 1, 1983
15.305
+1.505
10.91%
jan 1, 1984
14.22
-1.085
-7.09%
jan 1, 1985
13.54
-0.68
-4.78%
jan 1, 1986
15.164
+1.624
12.0%
jan 1, 1987
14.614
-0.55
-3.63%
jan 1, 1988
11.649
-2.966
-20.29%
jan 1, 1989
15.423
+3.775
32.4%
jan 1, 1990
14.005
-1.418
-9.2%
jan 1, 1991
17.449
+3.444
24.59%
jan 1, 1992
16.084
-1.365
-7.82%
jan 1, 1993
14.838
-1.246
-7.75%
jan 1, 1994
11.116
-3.722
-25.08%
jan 1, 1995
13.752
+2.636
23.71%
jan 1, 1996
13.184
-0.568
-4.13%
jan 1, 1997
12.974
-0.211
-1.6%
jan 1, 1998
14.208
+1.235
9.52%
jan 1, 1999
14.544
+0.335
2.36%
jan 1, 2000
22.427
+7.884
54.21%
jan 1, 2001
17.574
-4.853
-21.64%
jan 1, 2002
16.18
-1.394
-7.93%
jan 1, 2003
19.121
+2.942
18.18%
jan 1, 2004
18.563
-0.559
-2.92%
jan 1, 2005
20.277
+1.714
9.23%
jan 1, 2006
23.311
+3.035
14.97%
jan 1, 2007
27.723
+4.411
18.92%
jan 1, 2008
30.952
+3.229
11.65%
jan 1, 2009
32.731
+1.779
5.75%
jan 1, 2010
32.194
-0.536
-1.64%
jan 1, 2011
30.999
-1.195
-3.71%
jan 1, 2012
29.527
-1.472
-4.75%
jan 1, 2013
32.899
+3.372
11.42%
jan 1, 2014
32.103
-0.797
-2.42%
Ranking of countries by current statistics by years


Comments: