29
/
en
AIzaSyAYiBZKx7MnpbEhh9jyipgxe19OcubqV5w
April 1, 2024
169260
Korea, Dem. People’s Rep.
PRK
true
2
1
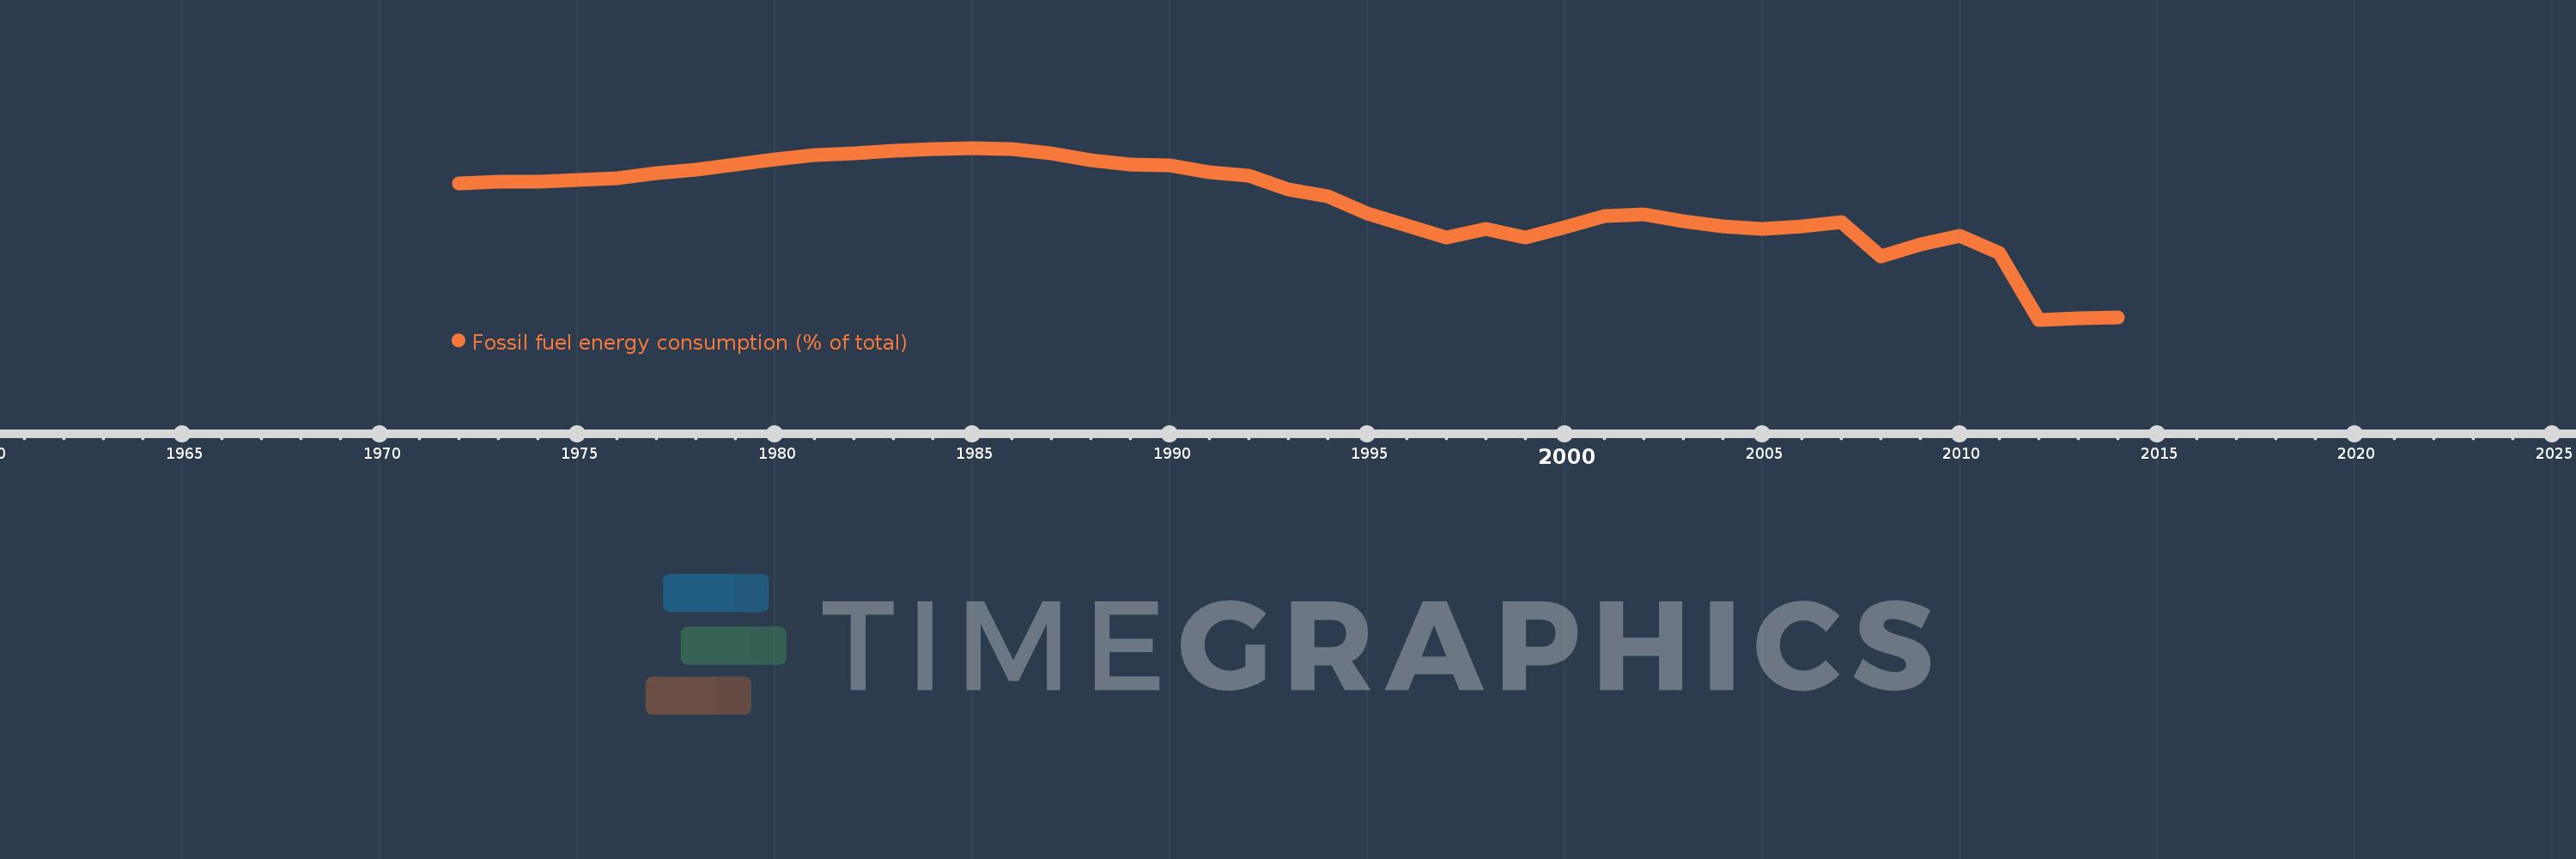
Fossil fuel energy consumption (% of total)
2014,2013,2012,2011,2010,2009,2008,2007,2006,2005,2004,2003,2002,2001,2000,1999,1998,1997,1996,1995,1994,1993,1992,1991,1990,1989,1988,1987,1986,1985,1984,1983,1982,1981,1980,1979,1978,1977,1976,1975,1974,1973,1972
This statistics in other country:
AlbaniaAlgeriaAngolaAntigua and BarbudaArab WorldArgentinaArmeniaAustraliaAustriaAzerbaijanBahamas, TheBahrainBangladeshBarbadosBelarusBelgiumBelizeBeninBhutanBoliviaBosnia and HerzegovinaBotswanaBrazilBrunei DarussalamBulgariaCabo VerdeCambodiaCameroonCanadaCaribbean small statesCentral Europe and the BalticsChileChinaColombiaComorosCongo, Dem. Rep.Congo, Rep.Costa RicaCote d'IvoireCroatiaCubaCuracaoCyprusCzech RepublicDenmarkDjiboutiDominicaDominican RepublicEarly-demographic dividendEast Asia & PacificEast Asia & Pacific (excluding high income)East Asia & Pacific (IDA & IBRD countries)EcuadorEgypt, Arab Rep.El SalvadorEquatorial GuineaEritreaEstoniaEthiopiaEuro areaEurope & Central AsiaEurope & Central Asia (excluding high income)Europe & Central Asia (IDA & IBRD countries)European UnionFijiFinlandFragile and conflict affected situationsFranceGabonGambia, TheGeorgiaGermanyGhanaGibraltarGreeceGrenadaGuatemalaGuinea-BissauGuyanaHaitiHeavily indebted poor countries (HIPC)High incomeHondurasHong Kong SAR, ChinaHungaryIBRD onlyIcelandIDA & IBRD totalIDA blendIDA onlyIDA totalIndiaIndonesiaIran, Islamic Rep.IraqIrelandIsraelItalyJamaicaJapanJordanKazakhstanKenyaKiribatiKorea, Dem. People’s Rep.Korea, Rep.KosovoKuwaitKyrgyz RepublicLate-demographic dividendLatin America & Caribbean Latin America & Caribbean (excluding high income)Latin America & the Caribbean (IDA & IBRD countries)LatviaLeast developed countries: UN classificationLebanonLesothoLibyaLithuaniaLow & middle incomeLow incomeLower middle incomeLuxembourgMacedonia, FYRMalaysiaMaldivesMaltaMarshall IslandsMauritiusMexicoMiddle East & North AfricaMiddle East & North Africa (excluding high income)Middle East & North Africa (IDA & IBRD countries)Middle incomeMoldovaMongoliaMontenegroMoroccoMozambiqueMyanmarNamibiaNepalNetherlandsNew ZealandNicaraguaNigerNigeriaNorth AmericaNorwayOECD membersOmanOther small statesPacific island small statesPakistanPalauPanamaParaguayPeruPhilippinesPolandPortugalPost-demographic dividendPre-demographic dividendQatarRomaniaRussian FederationSamoaSao Tome and PrincipeSaudi ArabiaSenegalSerbiaSeychellesSingaporeSlovak RepublicSloveniaSmall statesSolomon IslandsSouth AfricaSouth AsiaSouth Asia (IDA & IBRD)South SudanSpainSri LankaSt. Kitts and NevisSt. LuciaSt. Vincent and the GrenadinesSub-Saharan Africa Sub-Saharan Africa (excluding high income)Sub-Saharan Africa (IDA & IBRD countries)SudanSurinameSwazilandSwedenSwitzerlandSyrian Arab RepublicTajikistanTanzaniaThailandTimor-LesteTogoTongaTrinidad and TobagoTunisiaTurkeyUkraineUnited Arab EmiratesUnited KingdomUnited StatesUpper middle incomeUruguayUzbekistanVanuatuVenezuela, RBVietnamWorldYemen, Rep.ZambiaZimbabwe Timeline:
This timeline shows a graph from 1972 to 2014 of Korea, Dem. People’s Rep.. No data until 1971. Number of actual observations by date: 43.
Source name:
World Development Indicators
Source organization:
IEA Statistics © OECD/IEA 2014 (http://www.iea.org/stats/index.asp), subject to https://www.iea.org/t&c/termsandconditions/
Categories, topics:
Energy & Mining
Last updated:
apr 23, 2017
Indicators value changes by year
Minimum:
84.179
jan 1, 2012
Maximum:
94.585
jan 1, 1985
At the date of observation
Value
Absolute change
Change from previous value
jan 1, 1972
92.434
+92.434
0.0%
jan 1, 1973
92.551
+0.117
0.13%
jan 1, 1974
92.529
-0.022
-0.02%
jan 1, 1975
92.67
+0.141
0.15%
jan 1, 1976
92.766
+0.096
0.1%
jan 1, 1977
93.044
+0.278
0.3%
jan 1, 1978
93.264
+0.22
0.24%
jan 1, 1979
93.6
+0.336
0.36%
jan 1, 1980
93.896
+0.297
0.32%
jan 1, 1981
94.164
+0.267
0.28%
jan 1, 1982
94.236
+0.072
0.08%
jan 1, 1983
94.405
+0.169
0.18%
jan 1, 1984
94.529
+0.124
0.13%
jan 1, 1985
94.585
+0.056
0.06%
jan 1, 1986
94.507
-0.078
-0.08%
jan 1, 1987
94.256
-0.251
-0.27%
jan 1, 1988
93.859
-0.397
-0.42%
jan 1, 1989
93.595
-0.263
-0.28%
jan 1, 1990
93.542
-0.053
-0.06%
jan 1, 1991
93.089
-0.454
-0.49%
jan 1, 1992
92.887
-0.201
-0.22%
jan 1, 1993
92.073
-0.815
-0.88%
jan 1, 1994
91.646
-0.427
-0.46%
jan 1, 1995
90.633
-1.013
-1.11%
jan 1, 1996
89.863
-0.77
-0.85%
jan 1, 1997
89.172
-0.691
-0.77%
jan 1, 1998
89.679
+0.507
0.57%
jan 1, 1999
89.137
-0.541
-0.6%
jan 1, 2000
89.766
+0.628
0.71%
jan 1, 2001
90.455
+0.689
0.77%
jan 1, 2002
90.567
+0.112
0.12%
jan 1, 2003
90.125
-0.442
-0.49%
jan 1, 2004
89.837
-0.288
-0.32%
jan 1, 2005
89.701
-0.136
-0.15%
jan 1, 2006
89.816
+0.114
0.13%
jan 1, 2007
90.089
+0.273
0.3%
jan 1, 2008
87.989
-2.1
-2.33%
jan 1, 2009
88.735
+0.746
0.85%
jan 1, 2010
89.241
+0.506
0.57%
jan 1, 2011
88.225
-1.016
-1.14%
jan 1, 2012
84.179
-4.046
-4.59%
jan 1, 2013
84.245
+0.066
0.08%
jan 1, 2014
84.299
+0.054
0.06%
Ranking of countries by current statistics by years


Comments: