29
/
en
AIzaSyAYiBZKx7MnpbEhh9jyipgxe19OcubqV5w
April 1, 2024
277962
Uruguay
URY
true
2
1
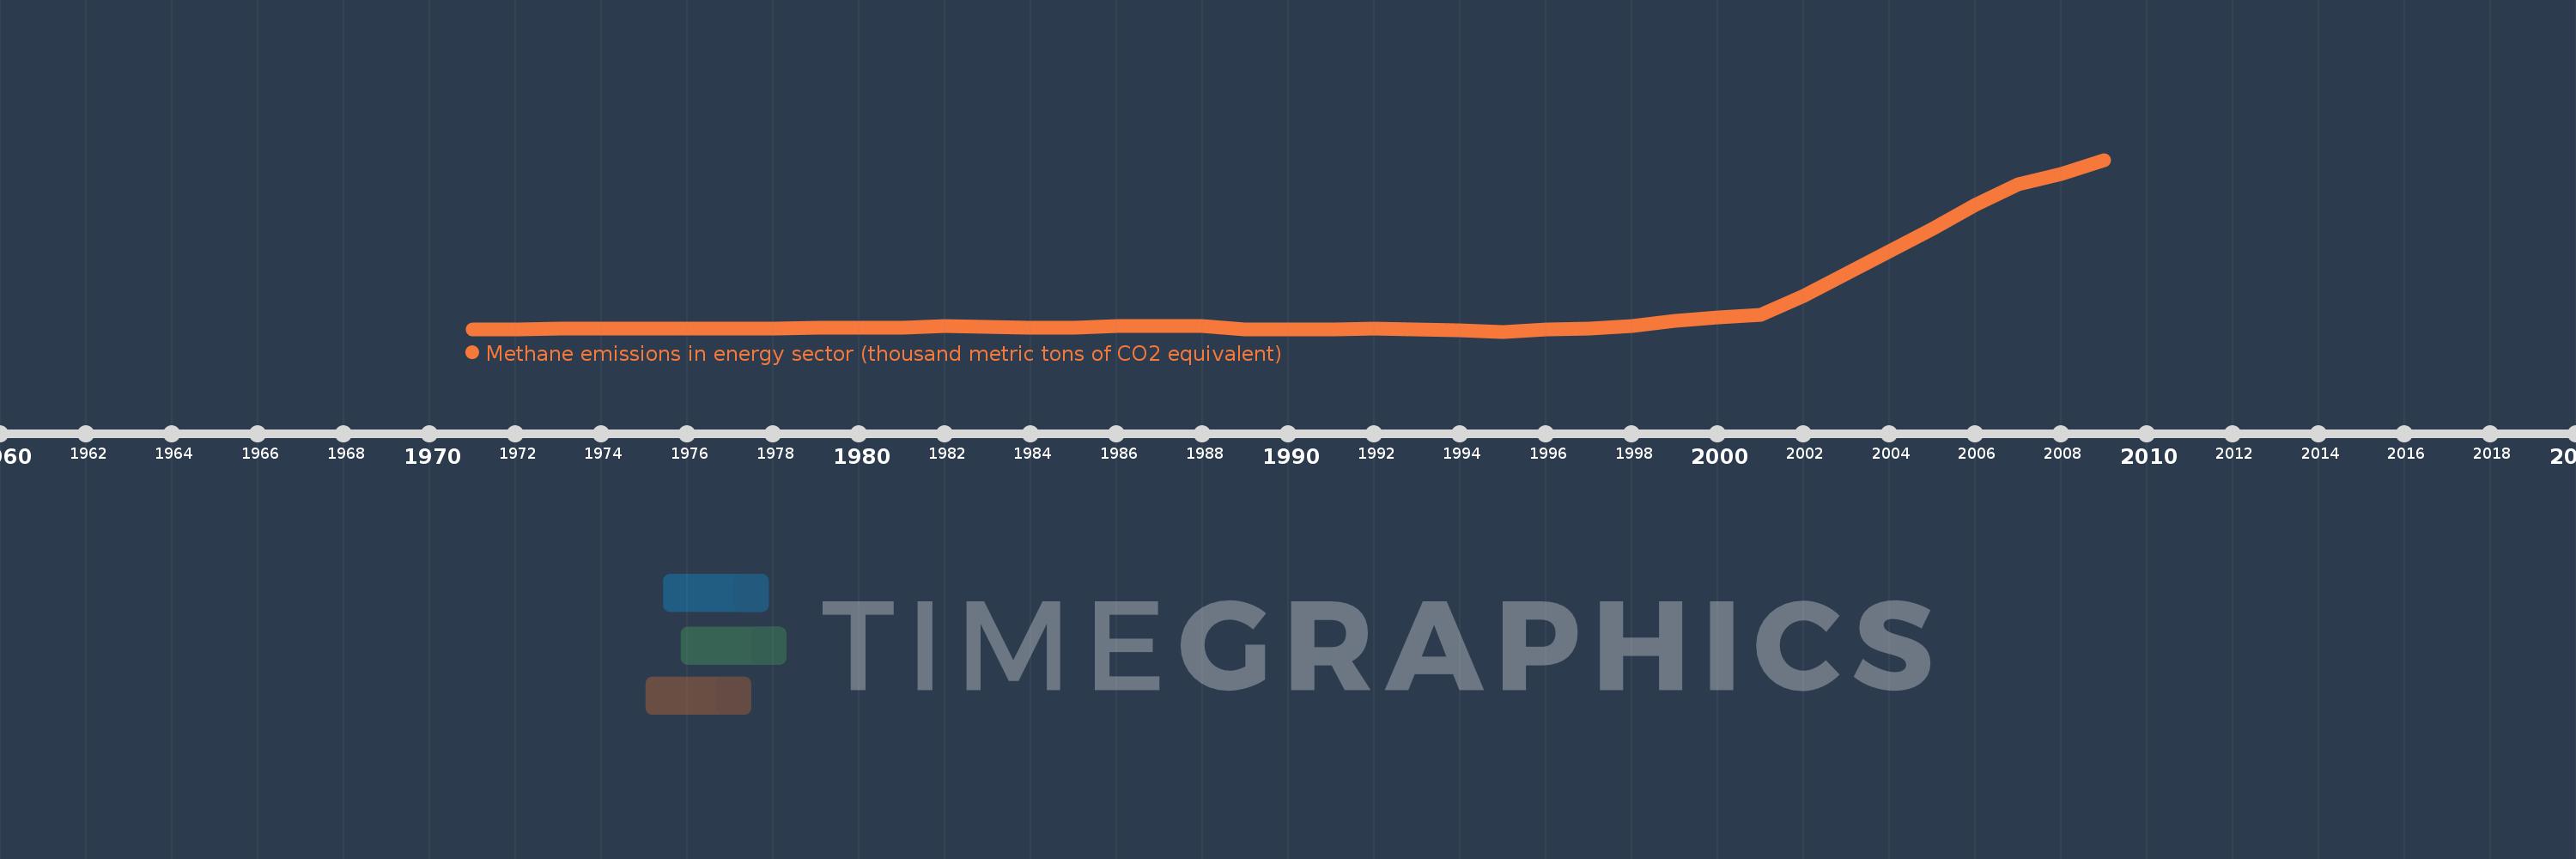
Methane emissions in energy sector (thousand metric tons of CO2 equivalent)
2009,2008,2007,2006,2005,2004,2003,2002,2001,2000,1999,1998,1997,1996,1995,1994,1993,1992,1991,1990,1989,1988,1987,1986,1985,1984,1983,1982,1981,1980,1979,1978,1977,1976,1975,1974,1973,1972,1971
This statistics in other country:
AfghanistanAlbaniaAlgeriaAmerican SamoaAndorraAngolaAntigua and BarbudaArab WorldArgentinaArmeniaArubaAustraliaAustriaAzerbaijanBahamas, TheBahrainBangladeshBarbadosBelarusBelgiumBelizeBeninBermudaBhutanBoliviaBosnia and HerzegovinaBotswanaBrazilBritish Virgin IslandsBrunei DarussalamBulgariaBurkina FasoBurundiCabo VerdeCambodiaCameroonCanadaCaribbean small statesCayman IslandsCentral African RepublicCentral Europe and the BalticsChadChannel IslandsChileChinaColombiaComorosCongo, Dem. Rep.Congo, Rep.Costa RicaCote d'IvoireCroatiaCubaCuracaoCyprusCzech RepublicDenmarkDjiboutiDominicaDominican RepublicEarly-demographic dividendEast Asia & PacificEast Asia & Pacific (excluding high income)East Asia & Pacific (IDA & IBRD countries)EcuadorEgypt, Arab Rep.El SalvadorEquatorial GuineaEritreaEstoniaEthiopiaEuro areaEurope & Central AsiaEurope & Central Asia (excluding high income)Europe & Central Asia (IDA & IBRD countries)European UnionFaroe IslandsFijiFinlandFragile and conflict affected situationsFranceFrench PolynesiaGabonGambia, TheGeorgiaGermanyGhanaGibraltarGreeceGreenlandGrenadaGuamGuatemalaGuineaGuinea-BissauGuyanaHaitiHeavily indebted poor countries (HIPC)High incomeHondurasHong Kong SAR, ChinaHungaryIBRD onlyIcelandIDA & IBRD totalIDA blendIDA onlyIDA totalIndiaIndonesiaIran, Islamic Rep.IraqIrelandIsle of ManIsraelItalyJamaicaJapanJordanKazakhstanKenyaKiribatiKorea, Dem. People’s Rep.Korea, Rep.KosovoKuwaitKyrgyz RepublicLao PDRLate-demographic dividendLatin America & Caribbean Latin America & Caribbean (excluding high income)Latin America & the Caribbean (IDA & IBRD countries)LatviaLeast developed countries: UN classificationLebanonLesothoLiberiaLibyaLiechtensteinLithuaniaLow & middle incomeLow incomeLower middle incomeLuxembourgMacao SAR, ChinaMacedonia, FYRMadagascarMalawiMalaysiaMaldivesMaliMaltaMarshall IslandsMauritaniaMauritiusMexicoMicronesia, Fed. Sts.Middle East & North AfricaMiddle East & North Africa (excluding high income)Middle East & North Africa (IDA & IBRD countries)Middle incomeMoldovaMonacoMongoliaMontenegroMoroccoMozambiqueMyanmarNamibiaNauruNepalNetherlandsNew CaledoniaNew ZealandNicaraguaNigerNigeriaNorth AmericaNorthern Mariana IslandsNorwayOECD membersOmanOther small statesPacific island small statesPakistanPalauPanamaPapua New GuineaParaguayPeruPhilippinesPolandPortugalPost-demographic dividendPre-demographic dividendPuerto RicoQatarRomaniaRussian FederationRwandaSamoaSan MarinoSao Tome and PrincipeSaudi ArabiaSenegalSerbiaSeychellesSierra LeoneSingaporeSint Maarten (Dutch part)Slovak RepublicSloveniaSmall statesSolomon IslandsSomaliaSouth AfricaSouth AsiaSouth Asia (IDA & IBRD)South SudanSpainSri LankaSt. Kitts and NevisSt. LuciaSt. Martin (French part)St. Vincent and the GrenadinesSub-Saharan Africa Sub-Saharan Africa (excluding high income)Sub-Saharan Africa (IDA & IBRD countries)SudanSurinameSwazilandSwedenSwitzerlandSyrian Arab RepublicTajikistanTanzaniaThailandTimor-LesteTogoTongaTrinidad and TobagoTunisiaTurkeyTurkmenistanTurks and Caicos IslandsTuvaluUgandaUkraineUnited Arab EmiratesUnited KingdomUnited StatesUpper middle incomeUruguayUzbekistanVanuatuVenezuela, RBVietnamVirgin Islands (U.S.)West Bank and GazaWorldYemen, Rep.ZambiaZimbabwe Timeline:
This timeline shows a graph from 1971 to 2009 of Uruguay. No data until 1970. Number of actual observations by date: 39.
Source name:
World Development Indicators
Source organization:
European Commission, Joint Research Centre (JRC)/Netherlands Environmental Assessment Agency (PBL). Emission Database for Global Atmospheric Research (EDGAR): http://edgar.jrc.ec.europa.eu/
Categories, topics:
Energy & Mining, Environment
Last updated:
apr 23, 2017
Indicators value changes by year
Minimum:
103.251
jan 1, 1995
Maximum:
622.733
jan 1, 2009
At the date of observation
Value
Absolute change
Change from previous value
jan 1, 1971
110.792
+110.792
0.0%
jan 1, 1972
110.765
-0.027
-0.02%
jan 1, 1973
111.581
+0.816
0.74%
jan 1, 1974
111.38
-0.201
-0.18%
jan 1, 1975
111.267
-0.113
-0.1%
jan 1, 1976
112.167
+0.9
0.81%
jan 1, 1977
112.56
+0.393
0.35%
jan 1, 1978
113.373
+0.813
0.72%
jan 1, 1979
114.625
+1.252
1.1%
jan 1, 1980
115.493
+0.868
0.76%
jan 1, 1981
115.975
+0.481
0.42%
jan 1, 1982
119.109
+3.134
2.7%
jan 1, 1983
117.301
-1.808
-1.52%
jan 1, 1984
113.983
-3.318
-2.83%
jan 1, 1985
114.081
+0.098
0.09%
jan 1, 1986
119.035
+4.954
4.34%
jan 1, 1987
119.905
+0.87
0.73%
jan 1, 1988
119.818
-0.088
-0.07%
jan 1, 1989
110.076
-9.741
-8.13%
jan 1, 1990
110.139
+0.063
0.06%
jan 1, 1991
110.267
+0.128
0.12%
jan 1, 1992
111.592
+1.326
1.2%
jan 1, 1993
110.761
-0.831
-0.74%
jan 1, 1994
105.879
-4.882
-4.41%
jan 1, 1995
103.251
-2.628
-2.48%
jan 1, 1996
108.534
+5.283
5.12%
jan 1, 1997
111.194
+2.66
2.45%
jan 1, 1998
119.137
+7.943
7.14%
jan 1, 1999
134.939
+15.802
13.26%
jan 1, 2000
146.466
+11.527
8.54%
jan 1, 2001
154.243
+7.777
5.31%
jan 1, 2002
209.919
+55.676
36.1%
jan 1, 2003
278.415
+68.496
32.63%
jan 1, 2004
345.005
+66.59
23.92%
jan 1, 2005
414.845
+69.84
20.24%
jan 1, 2006
485.169
+70.324
16.95%
jan 1, 2007
549.434
+64.265
13.25%
jan 1, 2008
580.603
+31.17
5.67%
jan 1, 2009
622.733
+42.129
7.26%
Ranking of countries by current statistics by years


Comments: