29
/
en
AIzaSyAYiBZKx7MnpbEhh9jyipgxe19OcubqV5w
April 1, 2024
102699
Central African Republic
CAF
true
2
1
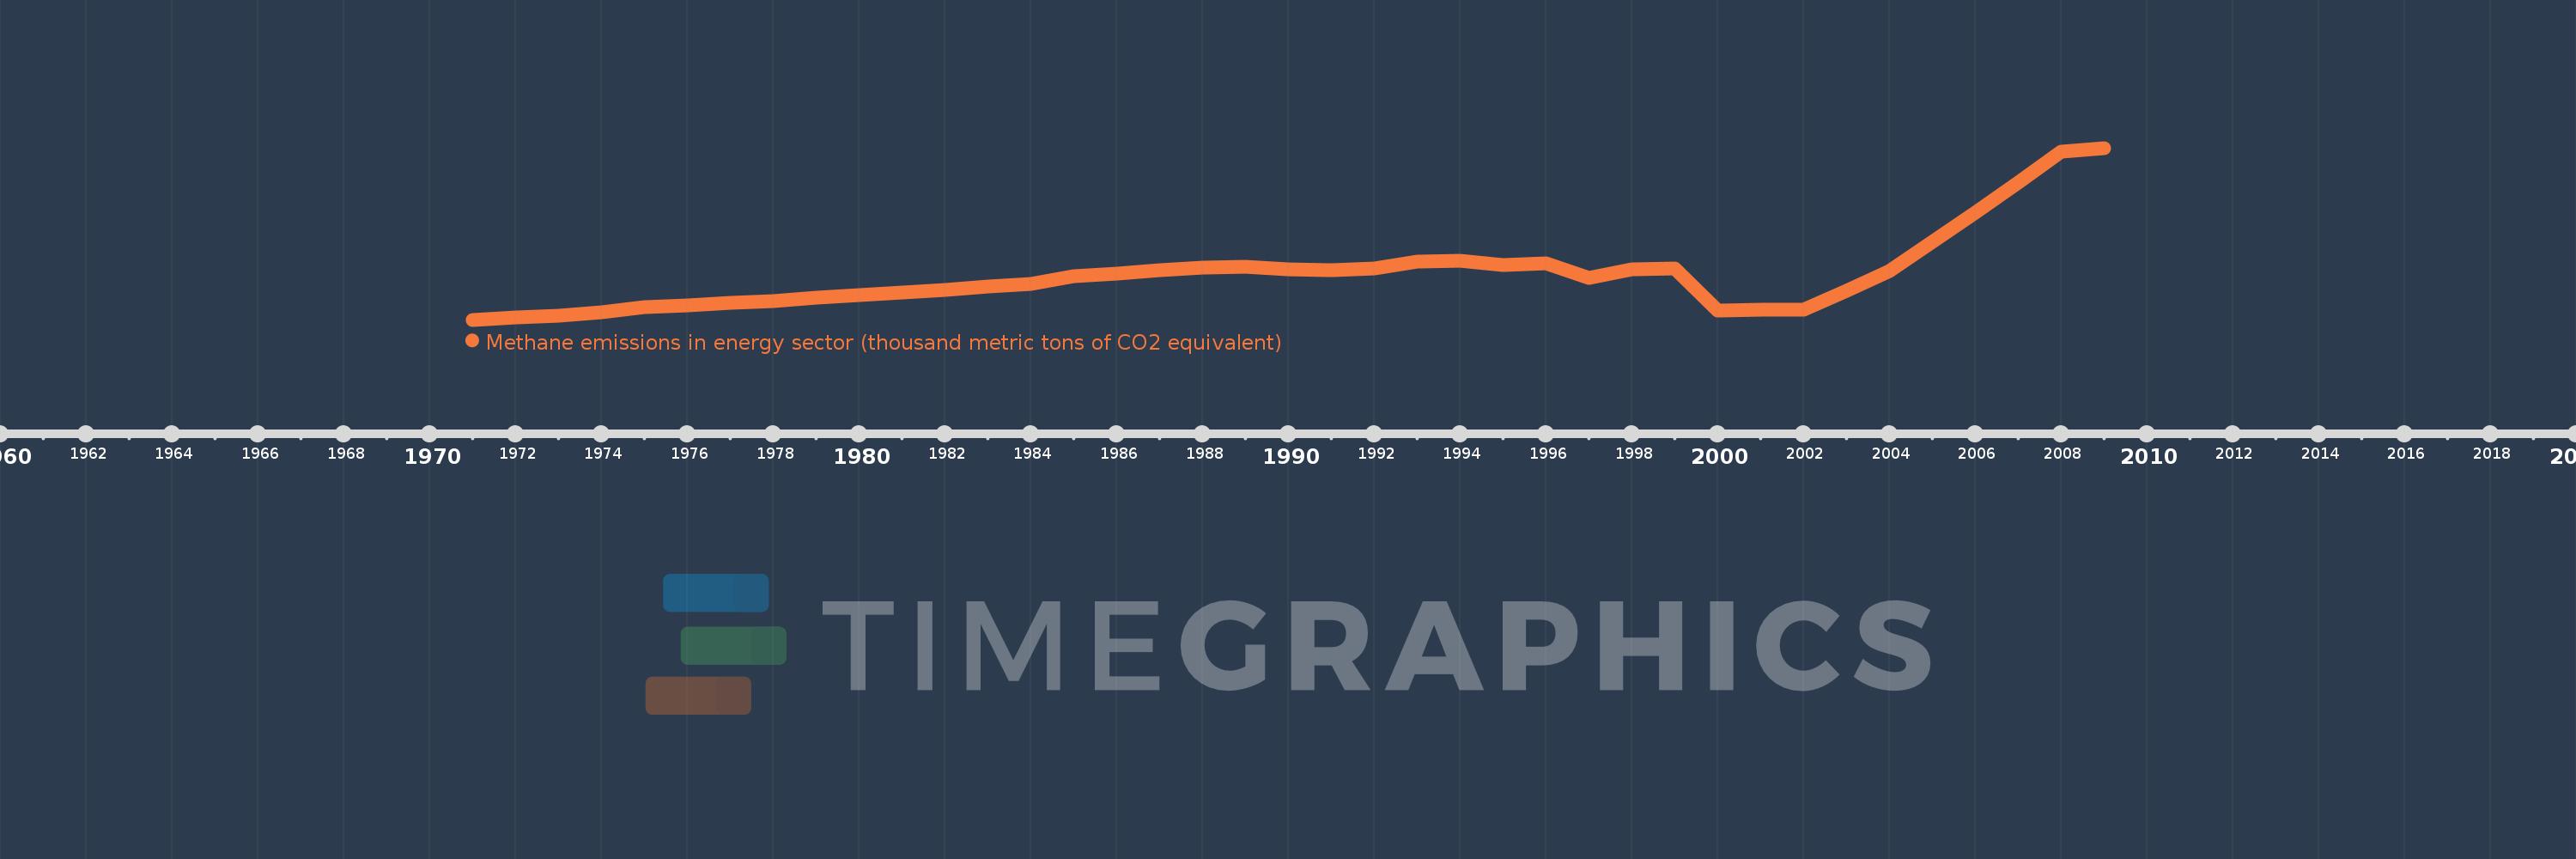
Methane emissions in energy sector (thousand metric tons of CO2 equivalent)
2009,2008,2007,2006,2005,2004,2003,2002,2001,2000,1999,1998,1997,1996,1995,1994,1993,1992,1991,1990,1989,1988,1987,1986,1985,1984,1983,1982,1981,1980,1979,1978,1977,1976,1975,1974,1973,1972,1971
This statistics in other country:
AfghanistanAlbaniaAlgeriaAmerican SamoaAndorraAngolaAntigua and BarbudaArab WorldArgentinaArmeniaArubaAustraliaAustriaAzerbaijanBahamas, TheBahrainBangladeshBarbadosBelarusBelgiumBelizeBeninBermudaBhutanBoliviaBosnia and HerzegovinaBotswanaBrazilBritish Virgin IslandsBrunei DarussalamBulgariaBurkina FasoBurundiCabo VerdeCambodiaCameroonCanadaCaribbean small statesCayman IslandsCentral African RepublicCentral Europe and the BalticsChadChannel IslandsChileChinaColombiaComorosCongo, Dem. Rep.Congo, Rep.Costa RicaCote d'IvoireCroatiaCubaCuracaoCyprusCzech RepublicDenmarkDjiboutiDominicaDominican RepublicEarly-demographic dividendEast Asia & PacificEast Asia & Pacific (excluding high income)East Asia & Pacific (IDA & IBRD countries)EcuadorEgypt, Arab Rep.El SalvadorEquatorial GuineaEritreaEstoniaEthiopiaEuro areaEurope & Central AsiaEurope & Central Asia (excluding high income)Europe & Central Asia (IDA & IBRD countries)European UnionFaroe IslandsFijiFinlandFragile and conflict affected situationsFranceFrench PolynesiaGabonGambia, TheGeorgiaGermanyGhanaGibraltarGreeceGreenlandGrenadaGuamGuatemalaGuineaGuinea-BissauGuyanaHaitiHeavily indebted poor countries (HIPC)High incomeHondurasHong Kong SAR, ChinaHungaryIBRD onlyIcelandIDA & IBRD totalIDA blendIDA onlyIDA totalIndiaIndonesiaIran, Islamic Rep.IraqIrelandIsle of ManIsraelItalyJamaicaJapanJordanKazakhstanKenyaKiribatiKorea, Dem. People’s Rep.Korea, Rep.KosovoKuwaitKyrgyz RepublicLao PDRLate-demographic dividendLatin America & Caribbean Latin America & Caribbean (excluding high income)Latin America & the Caribbean (IDA & IBRD countries)LatviaLeast developed countries: UN classificationLebanonLesothoLiberiaLibyaLiechtensteinLithuaniaLow & middle incomeLow incomeLower middle incomeLuxembourgMacao SAR, ChinaMacedonia, FYRMadagascarMalawiMalaysiaMaldivesMaliMaltaMarshall IslandsMauritaniaMauritiusMexicoMicronesia, Fed. Sts.Middle East & North AfricaMiddle East & North Africa (excluding high income)Middle East & North Africa (IDA & IBRD countries)Middle incomeMoldovaMonacoMongoliaMontenegroMoroccoMozambiqueMyanmarNamibiaNauruNepalNetherlandsNew CaledoniaNew ZealandNicaraguaNigerNigeriaNorth AmericaNorthern Mariana IslandsNorwayOECD membersOmanOther small statesPacific island small statesPakistanPalauPanamaPapua New GuineaParaguayPeruPhilippinesPolandPortugalPost-demographic dividendPre-demographic dividendPuerto RicoQatarRomaniaRussian FederationRwandaSamoaSan MarinoSao Tome and PrincipeSaudi ArabiaSenegalSerbiaSeychellesSierra LeoneSingaporeSint Maarten (Dutch part)Slovak RepublicSloveniaSmall statesSolomon IslandsSomaliaSouth AfricaSouth AsiaSouth Asia (IDA & IBRD)South SudanSpainSri LankaSt. Kitts and NevisSt. LuciaSt. Martin (French part)St. Vincent and the GrenadinesSub-Saharan Africa Sub-Saharan Africa (excluding high income)Sub-Saharan Africa (IDA & IBRD countries)SudanSurinameSwazilandSwedenSwitzerlandSyrian Arab RepublicTajikistanTanzaniaThailandTimor-LesteTogoTongaTrinidad and TobagoTunisiaTurkeyTurkmenistanTurks and Caicos IslandsTuvaluUgandaUkraineUnited Arab EmiratesUnited KingdomUnited StatesUpper middle incomeUruguayUzbekistanVanuatuVenezuela, RBVietnamVirgin Islands (U.S.)West Bank and GazaWorldYemen, Rep.ZambiaZimbabwe Timeline:
This timeline shows a graph from 1971 to 2009 of Central African Republic. No data until 1970. Number of actual observations by date: 39.
Source name:
World Development Indicators
Source organization:
European Commission, Joint Research Centre (JRC)/Netherlands Environmental Assessment Agency (PBL). Emission Database for Global Atmospheric Research (EDGAR): http://edgar.jrc.ec.europa.eu/
Categories, topics:
Energy & Mining, Environment
Last updated:
apr 23, 2017
Indicators value changes by year
Minimum:
188.606
jan 1, 1971
Maximum:
528.011
jan 1, 2009
At the date of observation
Value
Absolute change
Change from previous value
jan 1, 1971
188.606
+188.606
0.0%
jan 1, 1972
192.34
+3.734
1.98%
jan 1, 1973
196.429
+4.089
2.13%
jan 1, 1974
203.919
+7.49
3.81%
jan 1, 1975
213.129
+9.21
4.52%
jan 1, 1976
216.735
+3.606
1.69%
jan 1, 1977
221.402
+4.667
2.15%
jan 1, 1978
226.167
+4.765
2.15%
jan 1, 1979
231.422
+5.255
2.32%
jan 1, 1980
236.95
+5.528
2.39%
jan 1, 1981
242.78
+5.83
2.46%
jan 1, 1982
248.304
+5.524
2.28%
jan 1, 1983
254.096
+5.793
2.33%
jan 1, 1984
260.173
+6.077
2.39%
jan 1, 1985
274.124
+13.951
5.36%
jan 1, 1986
279.883
+5.759
2.1%
jan 1, 1987
286.834
+6.951
2.48%
jan 1, 1988
292.18
+5.345
1.86%
jan 1, 1989
294.016
+1.836
0.63%
jan 1, 1990
288.215
-5.801
-1.97%
jan 1, 1991
287.057
-1.158
-0.4%
jan 1, 1992
290.182
+3.125
1.09%
jan 1, 1993
303.636
+13.454
4.64%
jan 1, 1994
305.151
+1.515
0.5%
jan 1, 1995
297.539
-7.612
-2.49%
jan 1, 1996
300.209
+2.67
0.9%
jan 1, 1997
271.937
-28.272
-9.42%
jan 1, 1998
288.43
+16.493
6.07%
jan 1, 1999
289.187
+0.757
0.26%
jan 1, 2000
207.221
-81.966
-28.34%
jan 1, 2001
208.423
+1.201
0.58%
jan 1, 2002
209.144
+0.721
0.35%
jan 1, 2003
246.161
+37.018
17.7%
jan 1, 2004
284.952
+38.79
15.76%
jan 1, 2005
343.141
+58.189
20.42%
jan 1, 2006
400.932
+57.791
16.84%
jan 1, 2007
458.963
+58.03
14.47%
jan 1, 2008
521.223
+62.26
13.57%
jan 1, 2009
528.011
+6.788
1.3%
Ranking of countries by current statistics by years


Comments: