29
/
en
AIzaSyAYiBZKx7MnpbEhh9jyipgxe19OcubqV5w
April 1, 2024
230058
Russian Federation
RUS
true
2
1
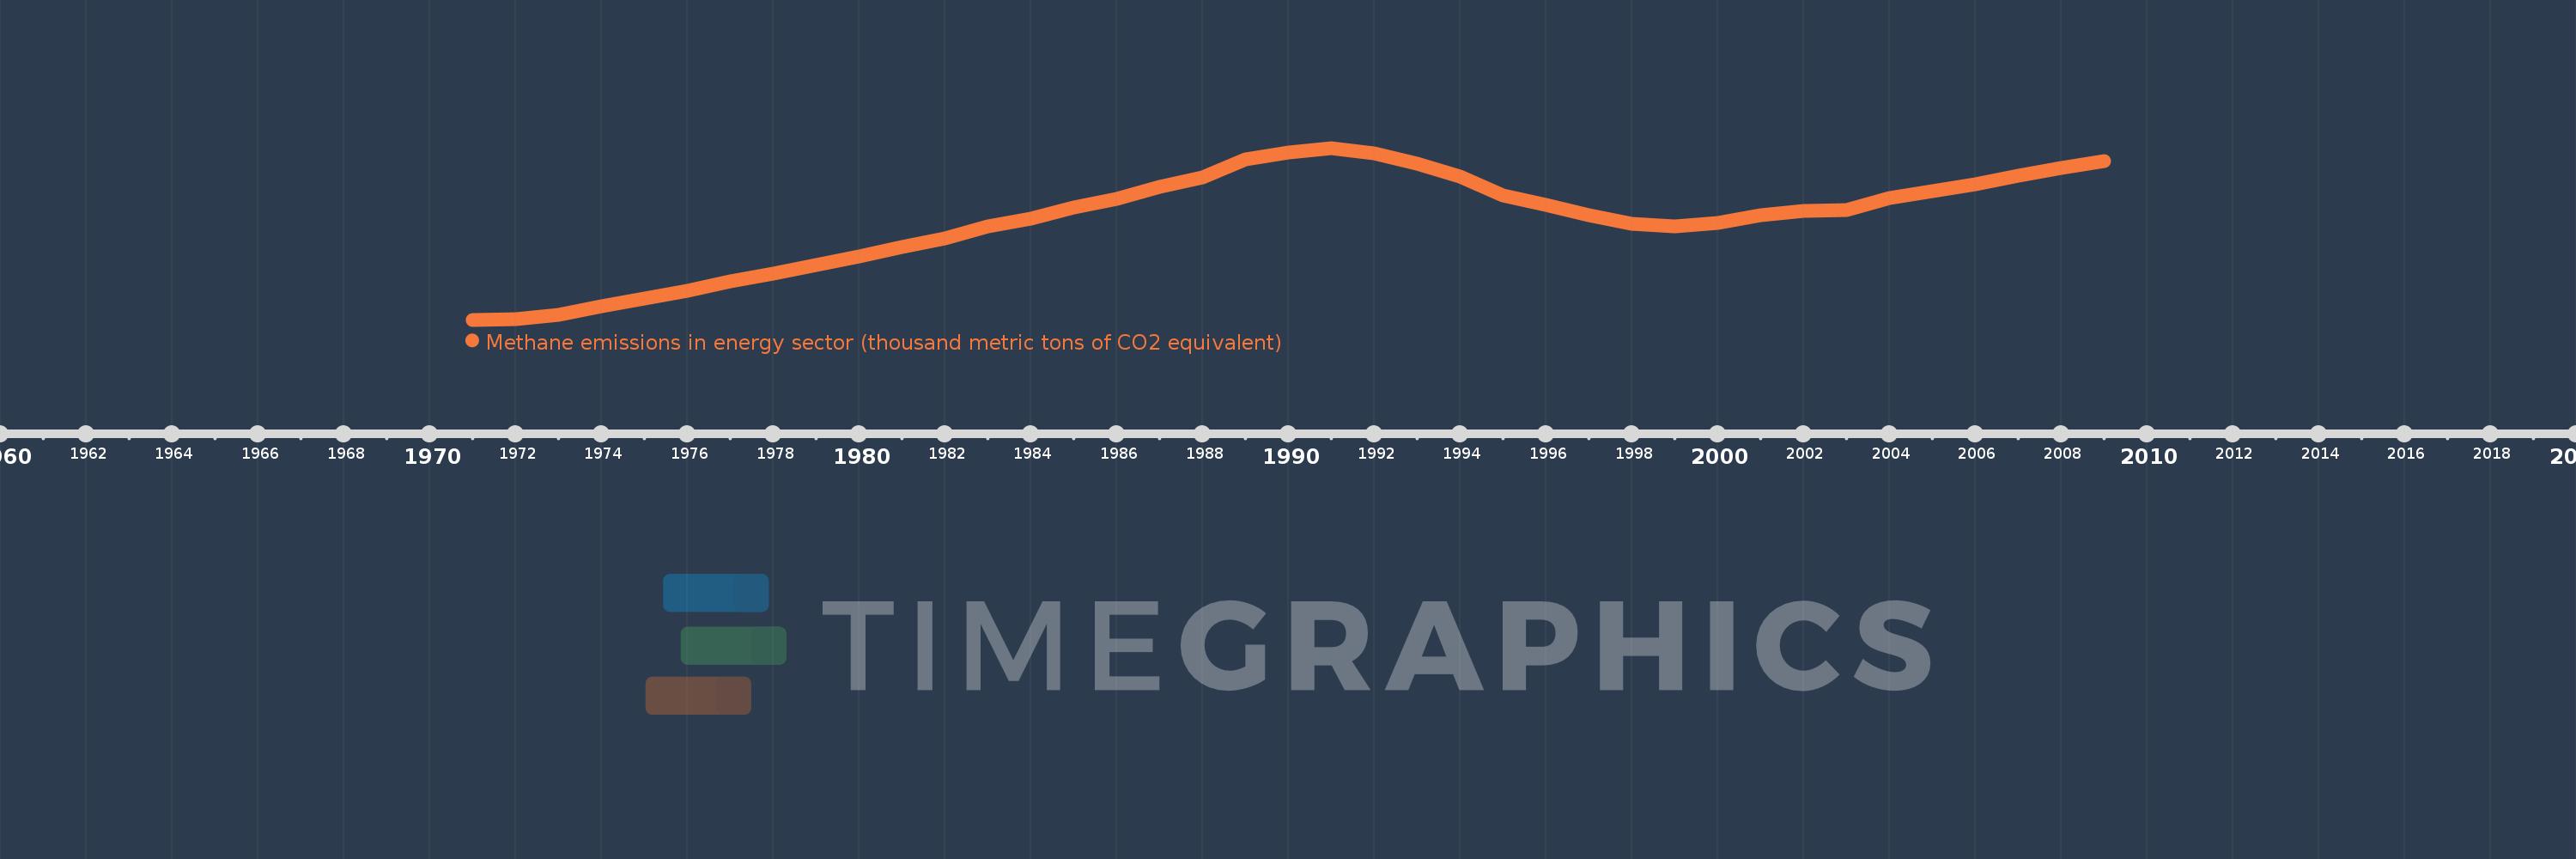
Methane emissions in energy sector (thousand metric tons of CO2 equivalent)
2009,2008,2007,2006,2005,2004,2003,2002,2001,2000,1999,1998,1997,1996,1995,1994,1993,1992,1991,1990,1989,1988,1987,1986,1985,1984,1983,1982,1981,1980,1979,1978,1977,1976,1975,1974,1973,1972,1971
This statistics in other country:
AfghanistanAlbaniaAlgeriaAmerican SamoaAndorraAngolaAntigua and BarbudaArab WorldArgentinaArmeniaArubaAustraliaAustriaAzerbaijanBahamas, TheBahrainBangladeshBarbadosBelarusBelgiumBelizeBeninBermudaBhutanBoliviaBosnia and HerzegovinaBotswanaBrazilBritish Virgin IslandsBrunei DarussalamBulgariaBurkina FasoBurundiCabo VerdeCambodiaCameroonCanadaCaribbean small statesCayman IslandsCentral African RepublicCentral Europe and the BalticsChadChannel IslandsChileChinaColombiaComorosCongo, Dem. Rep.Congo, Rep.Costa RicaCote d'IvoireCroatiaCubaCuracaoCyprusCzech RepublicDenmarkDjiboutiDominicaDominican RepublicEarly-demographic dividendEast Asia & PacificEast Asia & Pacific (excluding high income)East Asia & Pacific (IDA & IBRD countries)EcuadorEgypt, Arab Rep.El SalvadorEquatorial GuineaEritreaEstoniaEthiopiaEuro areaEurope & Central AsiaEurope & Central Asia (excluding high income)Europe & Central Asia (IDA & IBRD countries)European UnionFaroe IslandsFijiFinlandFragile and conflict affected situationsFranceFrench PolynesiaGabonGambia, TheGeorgiaGermanyGhanaGibraltarGreeceGreenlandGrenadaGuamGuatemalaGuineaGuinea-BissauGuyanaHaitiHeavily indebted poor countries (HIPC)High incomeHondurasHong Kong SAR, ChinaHungaryIBRD onlyIcelandIDA & IBRD totalIDA blendIDA onlyIDA totalIndiaIndonesiaIran, Islamic Rep.IraqIrelandIsle of ManIsraelItalyJamaicaJapanJordanKazakhstanKenyaKiribatiKorea, Dem. People’s Rep.Korea, Rep.KosovoKuwaitKyrgyz RepublicLao PDRLate-demographic dividendLatin America & Caribbean Latin America & Caribbean (excluding high income)Latin America & the Caribbean (IDA & IBRD countries)LatviaLeast developed countries: UN classificationLebanonLesothoLiberiaLibyaLiechtensteinLithuaniaLow & middle incomeLow incomeLower middle incomeLuxembourgMacao SAR, ChinaMacedonia, FYRMadagascarMalawiMalaysiaMaldivesMaliMaltaMarshall IslandsMauritaniaMauritiusMexicoMicronesia, Fed. Sts.Middle East & North AfricaMiddle East & North Africa (excluding high income)Middle East & North Africa (IDA & IBRD countries)Middle incomeMoldovaMonacoMongoliaMontenegroMoroccoMozambiqueMyanmarNamibiaNauruNepalNetherlandsNew CaledoniaNew ZealandNicaraguaNigerNigeriaNorth AmericaNorthern Mariana IslandsNorwayOECD membersOmanOther small statesPacific island small statesPakistanPalauPanamaPapua New GuineaParaguayPeruPhilippinesPolandPortugalPost-demographic dividendPre-demographic dividendPuerto RicoQatarRomaniaRussian FederationRwandaSamoaSan MarinoSao Tome and PrincipeSaudi ArabiaSenegalSerbiaSeychellesSierra LeoneSingaporeSint Maarten (Dutch part)Slovak RepublicSloveniaSmall statesSolomon IslandsSomaliaSouth AfricaSouth AsiaSouth Asia (IDA & IBRD)South SudanSpainSri LankaSt. Kitts and NevisSt. LuciaSt. Martin (French part)St. Vincent and the GrenadinesSub-Saharan Africa Sub-Saharan Africa (excluding high income)Sub-Saharan Africa (IDA & IBRD countries)SudanSurinameSwazilandSwedenSwitzerlandSyrian Arab RepublicTajikistanTanzaniaThailandTimor-LesteTogoTongaTrinidad and TobagoTunisiaTurkeyTurkmenistanTurks and Caicos IslandsTuvaluUgandaUkraineUnited Arab EmiratesUnited KingdomUnited StatesUpper middle incomeUruguayUzbekistanVanuatuVenezuela, RBVietnamVirgin Islands (U.S.)West Bank and GazaWorldYemen, Rep.ZambiaZimbabwe Timeline:
This timeline shows a graph from 1971 to 2009 of Russian Federation. No data until 1970. Number of actual observations by date: 39.
Source name:
World Development Indicators
Source organization:
European Commission, Joint Research Centre (JRC)/Netherlands Environmental Assessment Agency (PBL). Emission Database for Global Atmospheric Research (EDGAR): http://edgar.jrc.ec.europa.eu/
Categories, topics:
Energy & Mining, Environment
Last updated:
apr 23, 2017
Indicators value changes by year
Minimum:
205.855K
jan 1, 1971
Maximum:
422.993K
jan 1, 1991
At the date of observation
Value
Absolute change
Change from previous value
jan 1, 1971
205.855K
+205.855K
0.0%
jan 1, 1972
207.149K
+1.294K
0.63%
jan 1, 1973
212.199K
+5.05K
2.44%
jan 1, 1974
222.496K
+10.297K
4.85%
jan 1, 1975
232.387K
+9.891K
4.45%
jan 1, 1976
242.985K
+10.598K
4.56%
jan 1, 1977
254.001K
+11.016K
4.53%
jan 1, 1978
263.694K
+9.693K
3.82%
jan 1, 1979
275.425K
+11.731K
4.45%
jan 1, 1980
285.858K
+10.432K
3.79%
jan 1, 1981
297.915K
+12.057K
4.22%
jan 1, 1982
308.615K
+10.7K
3.59%
jan 1, 1983
323.963K
+15.349K
4.97%
jan 1, 1984
334.116K
+10.153K
3.13%
jan 1, 1985
348.101K
+13.986K
4.19%
jan 1, 1986
358.457K
+10.356K
2.97%
jan 1, 1987
373.956K
+15.499K
4.32%
jan 1, 1988
385.83K
+11.873K
3.18%
jan 1, 1989
408.733K
+22.904K
5.94%
jan 1, 1990
417.167K
+8.433K
2.06%
jan 1, 1991
422.993K
+5.827K
1.4%
jan 1, 1992
415.677K
-7.316K
-1.73%
jan 1, 1993
402.607K
-13.071K
-3.14%
jan 1, 1994
387.211K
-15.395K
-3.82%
jan 1, 1995
362.488K
-24.724K
-6.39%
jan 1, 1996
351.004K
-11.484K
-3.17%
jan 1, 1997
338.458K
-12.546K
-3.57%
jan 1, 1998
327.133K
-11.325K
-3.35%
jan 1, 1999
323.348K
-3.785K
-1.16%
jan 1, 2000
328.309K
+4.962K
1.53%
jan 1, 2001
337.767K
+9.458K
2.88%
jan 1, 2002
343.204K
+5.437K
1.61%
jan 1, 2003
344.901K
+1.696K
0.49%
jan 1, 2004
359.893K
+14.992K
4.35%
jan 1, 2005
368.592K
+8.699K
2.42%
jan 1, 2006
377.463K
+8.871K
2.41%
jan 1, 2007
387.915K
+10.452K
2.77%
jan 1, 2008
398.097K
+10.183K
2.62%
jan 1, 2009
406.731K
+8.634K
2.17%
Ranking of countries by current statistics by years


Comments: