29
/
en
AIzaSyAYiBZKx7MnpbEhh9jyipgxe19OcubqV5w
April 1, 2024
211995
Niger
NER
true
2
1
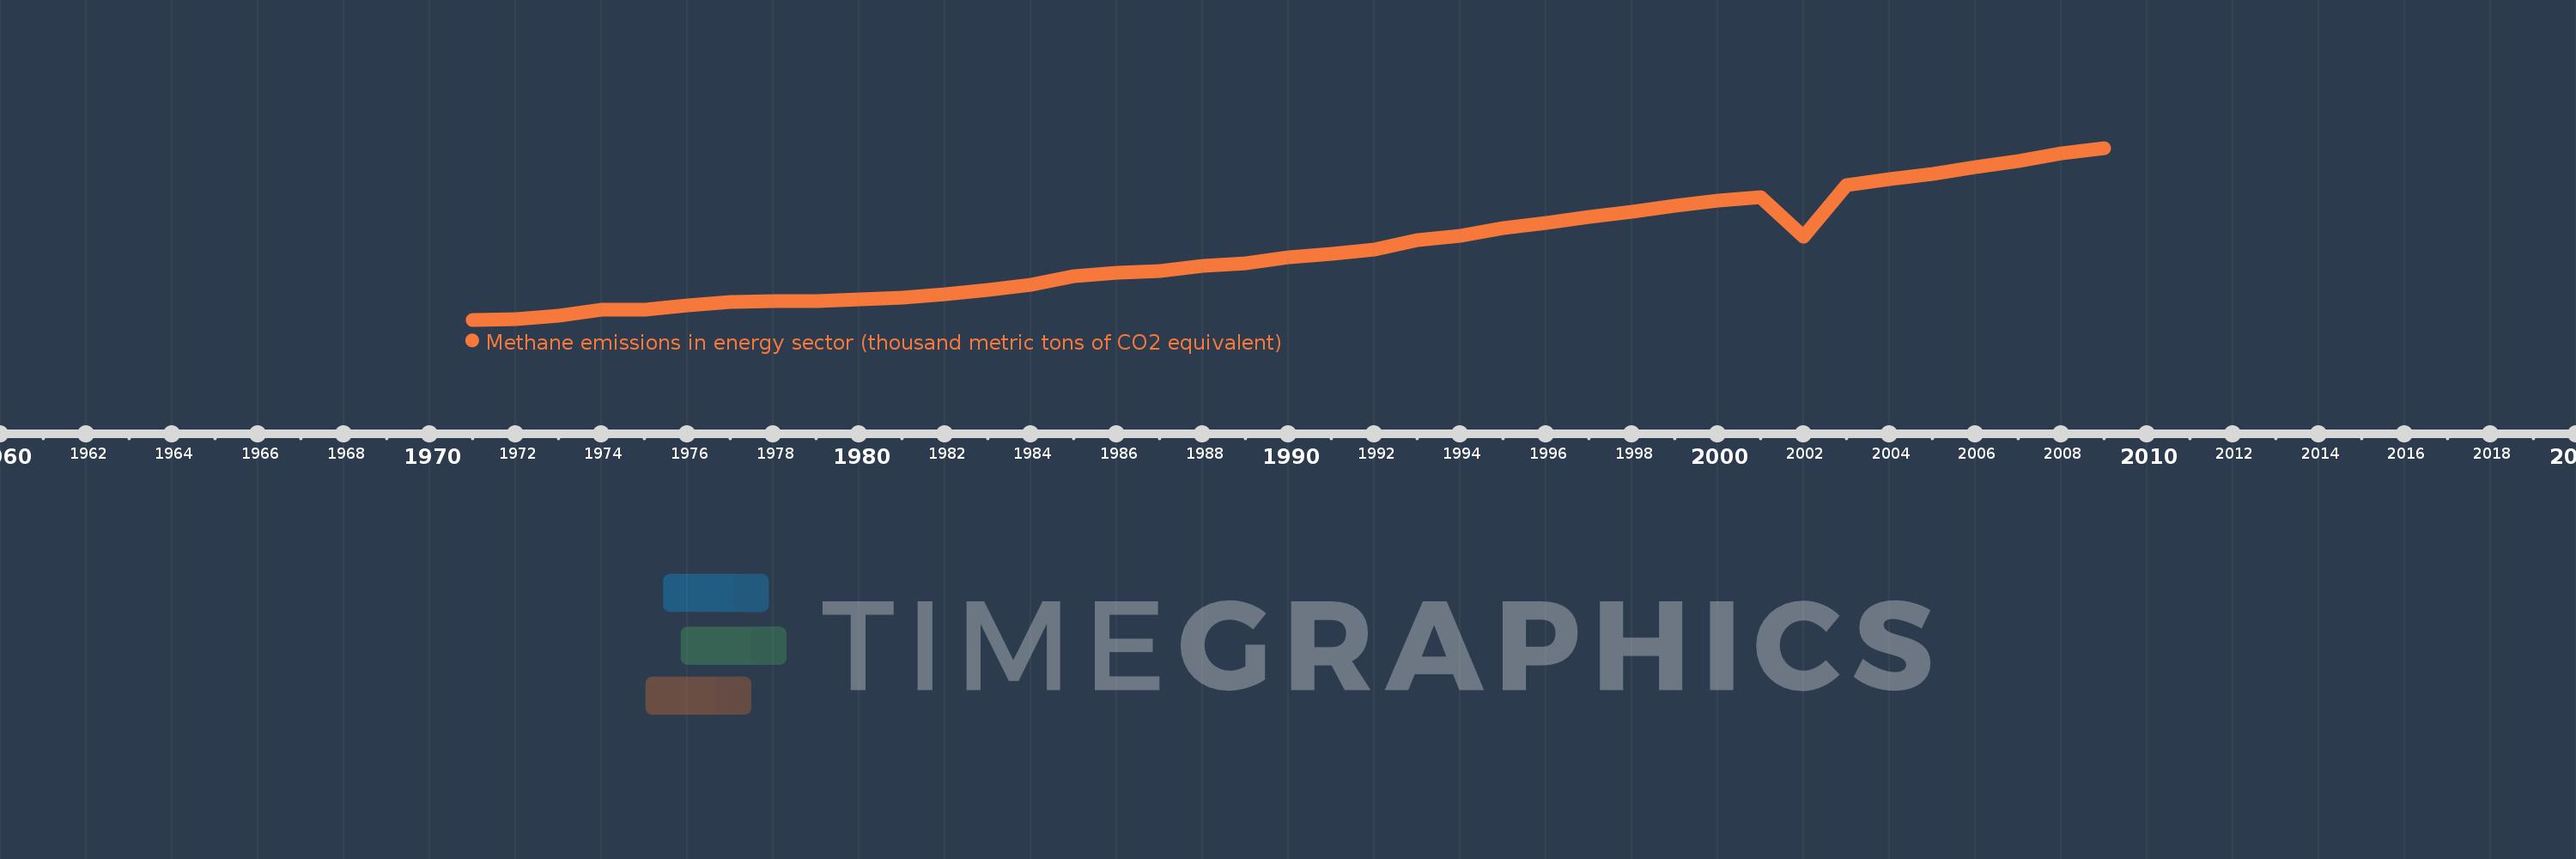
Methane emissions in energy sector (thousand metric tons of CO2 equivalent)
2009,2008,2007,2006,2005,2004,2003,2002,2001,2000,1999,1998,1997,1996,1995,1994,1993,1992,1991,1990,1989,1988,1987,1986,1985,1984,1983,1982,1981,1980,1979,1978,1977,1976,1975,1974,1973,1972,1971
This statistics in other country:
AfghanistanAlbaniaAlgeriaAmerican SamoaAndorraAngolaAntigua and BarbudaArab WorldArgentinaArmeniaArubaAustraliaAustriaAzerbaijanBahamas, TheBahrainBangladeshBarbadosBelarusBelgiumBelizeBeninBermudaBhutanBoliviaBosnia and HerzegovinaBotswanaBrazilBritish Virgin IslandsBrunei DarussalamBulgariaBurkina FasoBurundiCabo VerdeCambodiaCameroonCanadaCaribbean small statesCayman IslandsCentral African RepublicCentral Europe and the BalticsChadChannel IslandsChileChinaColombiaComorosCongo, Dem. Rep.Congo, Rep.Costa RicaCote d'IvoireCroatiaCubaCuracaoCyprusCzech RepublicDenmarkDjiboutiDominicaDominican RepublicEarly-demographic dividendEast Asia & PacificEast Asia & Pacific (excluding high income)East Asia & Pacific (IDA & IBRD countries)EcuadorEgypt, Arab Rep.El SalvadorEquatorial GuineaEritreaEstoniaEthiopiaEuro areaEurope & Central AsiaEurope & Central Asia (excluding high income)Europe & Central Asia (IDA & IBRD countries)European UnionFaroe IslandsFijiFinlandFragile and conflict affected situationsFranceFrench PolynesiaGabonGambia, TheGeorgiaGermanyGhanaGibraltarGreeceGreenlandGrenadaGuamGuatemalaGuineaGuinea-BissauGuyanaHaitiHeavily indebted poor countries (HIPC)High incomeHondurasHong Kong SAR, ChinaHungaryIBRD onlyIcelandIDA & IBRD totalIDA blendIDA onlyIDA totalIndiaIndonesiaIran, Islamic Rep.IraqIrelandIsle of ManIsraelItalyJamaicaJapanJordanKazakhstanKenyaKiribatiKorea, Dem. People’s Rep.Korea, Rep.KosovoKuwaitKyrgyz RepublicLao PDRLate-demographic dividendLatin America & Caribbean Latin America & Caribbean (excluding high income)Latin America & the Caribbean (IDA & IBRD countries)LatviaLeast developed countries: UN classificationLebanonLesothoLiberiaLibyaLiechtensteinLithuaniaLow & middle incomeLow incomeLower middle incomeLuxembourgMacao SAR, ChinaMacedonia, FYRMadagascarMalawiMalaysiaMaldivesMaliMaltaMarshall IslandsMauritaniaMauritiusMexicoMicronesia, Fed. Sts.Middle East & North AfricaMiddle East & North Africa (excluding high income)Middle East & North Africa (IDA & IBRD countries)Middle incomeMoldovaMonacoMongoliaMontenegroMoroccoMozambiqueMyanmarNamibiaNauruNepalNetherlandsNew CaledoniaNew ZealandNicaraguaNigerNigeriaNorth AmericaNorthern Mariana IslandsNorwayOECD membersOmanOther small statesPacific island small statesPakistanPalauPanamaPapua New GuineaParaguayPeruPhilippinesPolandPortugalPost-demographic dividendPre-demographic dividendPuerto RicoQatarRomaniaRussian FederationRwandaSamoaSan MarinoSao Tome and PrincipeSaudi ArabiaSenegalSerbiaSeychellesSierra LeoneSingaporeSint Maarten (Dutch part)Slovak RepublicSloveniaSmall statesSolomon IslandsSomaliaSouth AfricaSouth AsiaSouth Asia (IDA & IBRD)South SudanSpainSri LankaSt. Kitts and NevisSt. LuciaSt. Martin (French part)St. Vincent and the GrenadinesSub-Saharan Africa Sub-Saharan Africa (excluding high income)Sub-Saharan Africa (IDA & IBRD countries)SudanSurinameSwazilandSwedenSwitzerlandSyrian Arab RepublicTajikistanTanzaniaThailandTimor-LesteTogoTongaTrinidad and TobagoTunisiaTurkeyTurkmenistanTurks and Caicos IslandsTuvaluUgandaUkraineUnited Arab EmiratesUnited KingdomUnited StatesUpper middle incomeUruguayUzbekistanVanuatuVenezuela, RBVietnamVirgin Islands (U.S.)West Bank and GazaWorldYemen, Rep.ZambiaZimbabwe Timeline:
This timeline shows a graph from 1971 to 2009 of Niger. No data until 1970. Number of actual observations by date: 39.
Source name:
World Development Indicators
Source organization:
European Commission, Joint Research Centre (JRC)/Netherlands Environmental Assessment Agency (PBL). Emission Database for Global Atmospheric Research (EDGAR): http://edgar.jrc.ec.europa.eu/
Categories, topics:
Energy & Mining, Environment
Last updated:
apr 23, 2017
Indicators value changes by year
Minimum:
486.001
jan 1, 1971
Maximum:
1.856K
jan 1, 2009
At the date of observation
Value
Absolute change
Change from previous value
jan 1, 1971
486.001
+486.001
0.0%
jan 1, 1972
492.623
+6.622
1.36%
jan 1, 1973
515.545
+22.922
4.65%
jan 1, 1974
564.723
+49.179
9.54%
jan 1, 1975
568.758
+4.035
0.71%
jan 1, 1976
603.073
+34.314
6.03%
jan 1, 1977
624.792
+21.719
3.6%
jan 1, 1978
632.239
+7.447
1.19%
jan 1, 1979
635.439
+3.2
0.51%
jan 1, 1980
648.815
+13.376
2.11%
jan 1, 1981
664.452
+15.637
2.41%
jan 1, 1982
691.386
+26.934
4.05%
jan 1, 1983
725.915
+34.529
4.99%
jan 1, 1984
764.217
+38.303
5.28%
jan 1, 1985
836.592
+72.375
9.47%
jan 1, 1986
859.46
+22.868
2.73%
jan 1, 1987
871.098
+11.637
1.35%
jan 1, 1988
914.121
+43.024
4.94%
jan 1, 1989
936.867
+22.745
2.49%
jan 1, 1990
982.966
+46.099
4.92%
jan 1, 1991
1.01K
+27.042
2.75%
jan 1, 1992
1.046K
+35.756
3.54%
jan 1, 1993
1.121K
+75.056
7.18%
jan 1, 1994
1.158K
+36.823
3.29%
jan 1, 1995
1.216K
+58.187
5.03%
jan 1, 1996
1.26K
+43.821
3.6%
jan 1, 1997
1.305K
+45.017
3.57%
jan 1, 1998
1.349K
+44.533
3.41%
jan 1, 1999
1.394K
+44.521
3.3%
jan 1, 2000
1.437K
+42.873
3.08%
jan 1, 2001
1.465K
+28.605
1.99%
jan 1, 2002
1.148K
-317.156
-21.65%
jan 1, 2003
1.56K
+412.024
35.89%
jan 1, 2004
1.606K
+45.486
2.92%
jan 1, 2005
1.649K
+42.958
2.68%
jan 1, 2006
1.701K
+52.57
3.19%
jan 1, 2007
1.75K
+48.703
2.86%
jan 1, 2008
1.811K
+61.364
3.51%
jan 1, 2009
1.856K
+45.051
2.49%
Ranking of countries by current statistics by years


Comments: