29
/
en
AIzaSyAYiBZKx7MnpbEhh9jyipgxe19OcubqV5w
April 1, 2024
128538
Eritrea
ERI
true
2
1
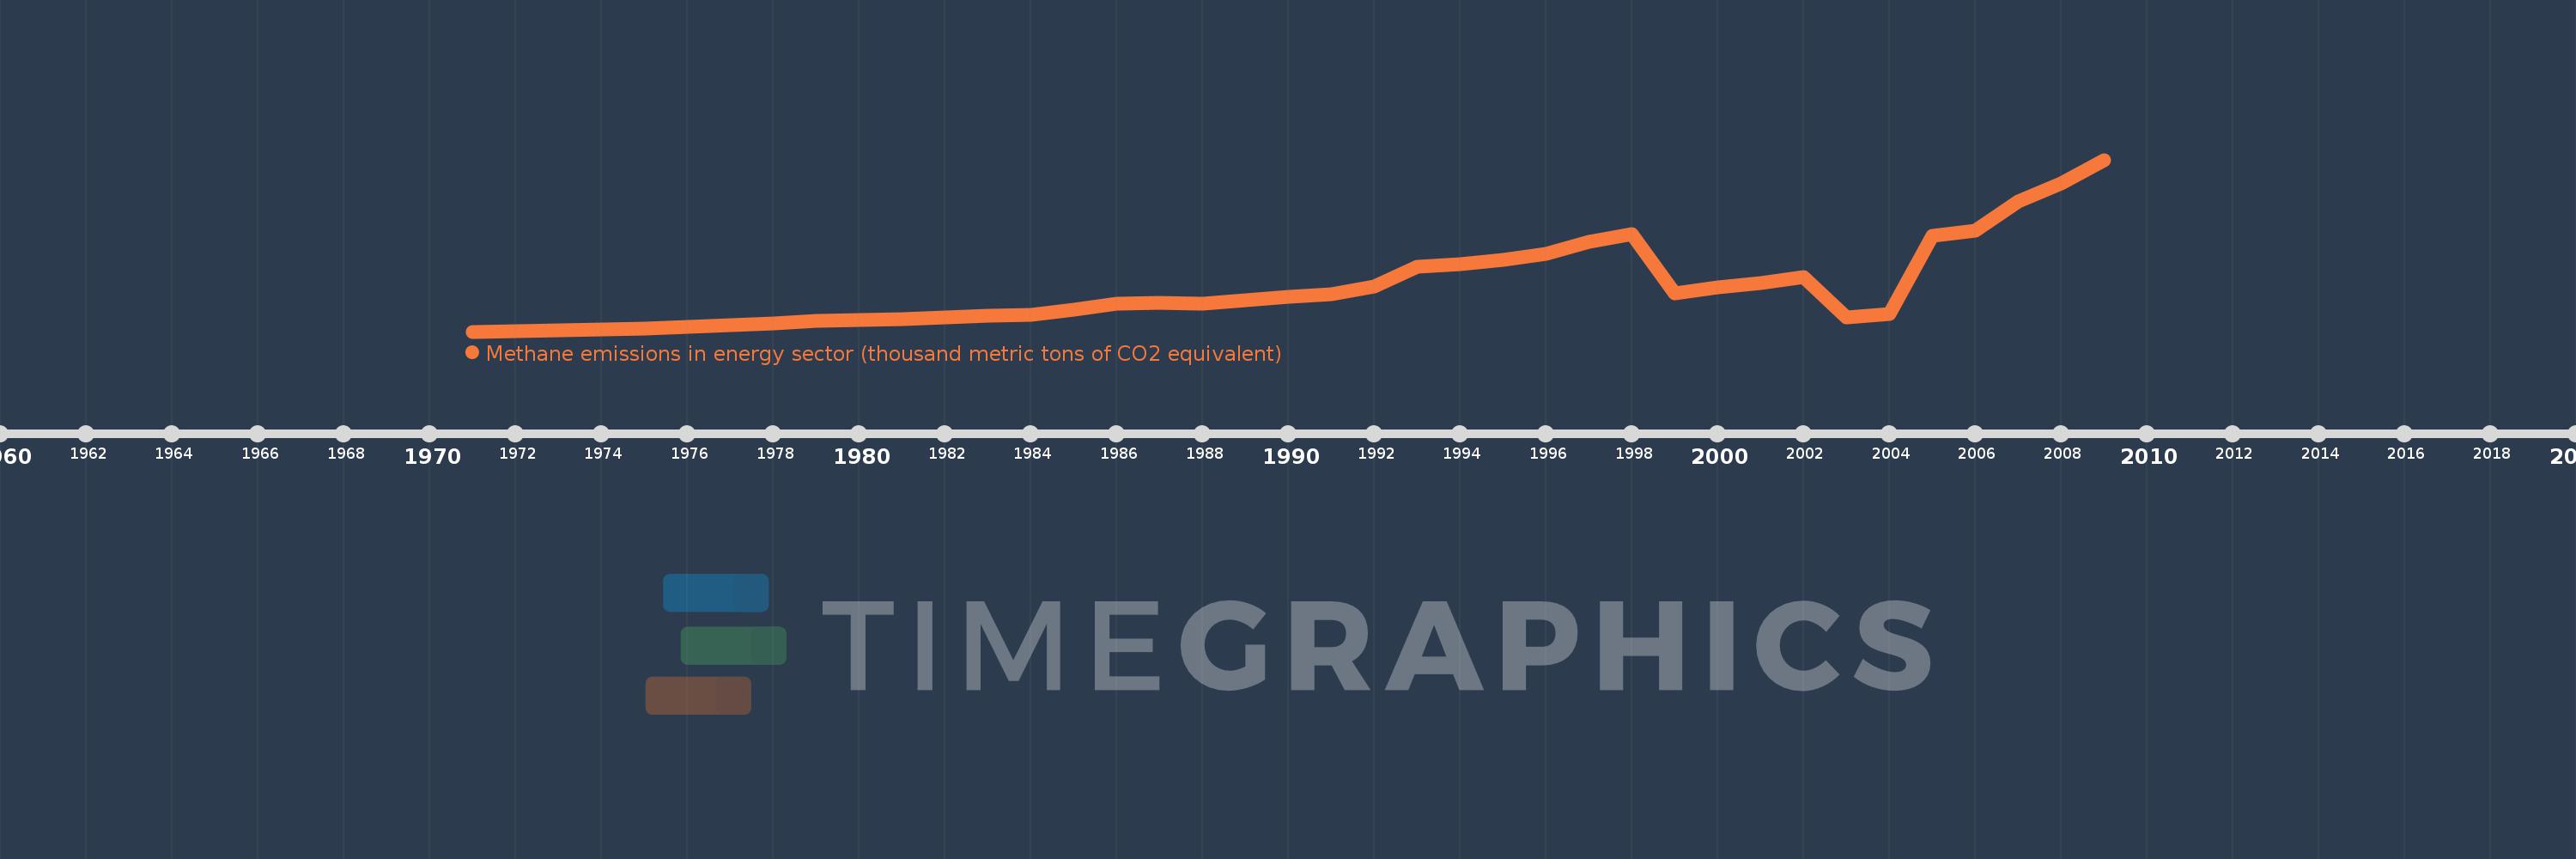
Methane emissions in energy sector (thousand metric tons of CO2 equivalent)
2009,2008,2007,2006,2005,2004,2003,2002,2001,2000,1999,1998,1997,1996,1995,1994,1993,1992,1991,1990,1989,1988,1987,1986,1985,1984,1983,1982,1981,1980,1979,1978,1977,1976,1975,1974,1973,1972,1971
This statistics in other country:
AfghanistanAlbaniaAlgeriaAmerican SamoaAndorraAngolaAntigua and BarbudaArab WorldArgentinaArmeniaArubaAustraliaAustriaAzerbaijanBahamas, TheBahrainBangladeshBarbadosBelarusBelgiumBelizeBeninBermudaBhutanBoliviaBosnia and HerzegovinaBotswanaBrazilBritish Virgin IslandsBrunei DarussalamBulgariaBurkina FasoBurundiCabo VerdeCambodiaCameroonCanadaCaribbean small statesCayman IslandsCentral African RepublicCentral Europe and the BalticsChadChannel IslandsChileChinaColombiaComorosCongo, Dem. Rep.Congo, Rep.Costa RicaCote d'IvoireCroatiaCubaCuracaoCyprusCzech RepublicDenmarkDjiboutiDominicaDominican RepublicEarly-demographic dividendEast Asia & PacificEast Asia & Pacific (excluding high income)East Asia & Pacific (IDA & IBRD countries)EcuadorEgypt, Arab Rep.El SalvadorEquatorial GuineaEritreaEstoniaEthiopiaEuro areaEurope & Central AsiaEurope & Central Asia (excluding high income)Europe & Central Asia (IDA & IBRD countries)European UnionFaroe IslandsFijiFinlandFragile and conflict affected situationsFranceFrench PolynesiaGabonGambia, TheGeorgiaGermanyGhanaGibraltarGreeceGreenlandGrenadaGuamGuatemalaGuineaGuinea-BissauGuyanaHaitiHeavily indebted poor countries (HIPC)High incomeHondurasHong Kong SAR, ChinaHungaryIBRD onlyIcelandIDA & IBRD totalIDA blendIDA onlyIDA totalIndiaIndonesiaIran, Islamic Rep.IraqIrelandIsle of ManIsraelItalyJamaicaJapanJordanKazakhstanKenyaKiribatiKorea, Dem. People’s Rep.Korea, Rep.KosovoKuwaitKyrgyz RepublicLao PDRLate-demographic dividendLatin America & Caribbean Latin America & Caribbean (excluding high income)Latin America & the Caribbean (IDA & IBRD countries)LatviaLeast developed countries: UN classificationLebanonLesothoLiberiaLibyaLiechtensteinLithuaniaLow & middle incomeLow incomeLower middle incomeLuxembourgMacao SAR, ChinaMacedonia, FYRMadagascarMalawiMalaysiaMaldivesMaliMaltaMarshall IslandsMauritaniaMauritiusMexicoMicronesia, Fed. Sts.Middle East & North AfricaMiddle East & North Africa (excluding high income)Middle East & North Africa (IDA & IBRD countries)Middle incomeMoldovaMonacoMongoliaMontenegroMoroccoMozambiqueMyanmarNamibiaNauruNepalNetherlandsNew CaledoniaNew ZealandNicaraguaNigerNigeriaNorth AmericaNorthern Mariana IslandsNorwayOECD membersOmanOther small statesPacific island small statesPakistanPalauPanamaPapua New GuineaParaguayPeruPhilippinesPolandPortugalPost-demographic dividendPre-demographic dividendPuerto RicoQatarRomaniaRussian FederationRwandaSamoaSan MarinoSao Tome and PrincipeSaudi ArabiaSenegalSerbiaSeychellesSierra LeoneSingaporeSint Maarten (Dutch part)Slovak RepublicSloveniaSmall statesSolomon IslandsSomaliaSouth AfricaSouth AsiaSouth Asia (IDA & IBRD)South SudanSpainSri LankaSt. Kitts and NevisSt. LuciaSt. Martin (French part)St. Vincent and the GrenadinesSub-Saharan Africa Sub-Saharan Africa (excluding high income)Sub-Saharan Africa (IDA & IBRD countries)SudanSurinameSwazilandSwedenSwitzerlandSyrian Arab RepublicTajikistanTanzaniaThailandTimor-LesteTogoTongaTrinidad and TobagoTunisiaTurkeyTurkmenistanTurks and Caicos IslandsTuvaluUgandaUkraineUnited Arab EmiratesUnited KingdomUnited StatesUpper middle incomeUruguayUzbekistanVanuatuVenezuela, RBVietnamVirgin Islands (U.S.)West Bank and GazaWorldYemen, Rep.ZambiaZimbabwe Timeline:
This timeline shows a graph from 1971 to 2009 of Eritrea. No data until 1970. Number of actual observations by date: 39.
Source name:
World Development Indicators
Source organization:
European Commission, Joint Research Centre (JRC)/Netherlands Environmental Assessment Agency (PBL). Emission Database for Global Atmospheric Research (EDGAR): http://edgar.jrc.ec.europa.eu/
Categories, topics:
Energy & Mining, Environment
Last updated:
apr 23, 2017
Indicators value changes by year
Minimum:
245.042
jan 1, 1971
Maximum:
544.076
jan 1, 2009
At the date of observation
Value
Absolute change
Change from previous value
jan 1, 1971
245.042
+245.042
0.0%
jan 1, 1972
246.396
+1.353
0.55%
jan 1, 1973
246.794
+0.398
0.16%
jan 1, 1974
248.554
+1.76
0.71%
jan 1, 1975
250.87
+2.316
0.93%
jan 1, 1976
253.628
+2.758
1.1%
jan 1, 1977
256.216
+2.589
1.02%
jan 1, 1978
259.41
+3.193
1.25%
jan 1, 1979
263.862
+4.452
1.72%
jan 1, 1980
265.364
+1.502
0.57%
jan 1, 1981
267.044
+1.68
0.63%
jan 1, 1982
269.807
+2.763
1.03%
jan 1, 1983
272.953
+3.146
1.17%
jan 1, 1984
274.59
+1.637
0.6%
jan 1, 1985
283.863
+9.273
3.38%
jan 1, 1986
293.545
+9.682
3.41%
jan 1, 1987
294.845
+1.3
0.44%
jan 1, 1988
293.463
-1.382
-0.47%
jan 1, 1989
299.347
+5.884
2.0%
jan 1, 1990
305.57
+6.224
2.08%
jan 1, 1991
310.408
+4.837
1.58%
jan 1, 1992
323.116
+12.708
4.09%
jan 1, 1993
357.471
+34.355
10.63%
jan 1, 1994
363.042
+5.571
1.56%
jan 1, 1995
369.592
+6.55
1.8%
jan 1, 1996
380.963
+11.371
3.08%
jan 1, 1997
400.812
+19.849
5.21%
jan 1, 1998
414.131
+13.319
3.32%
jan 1, 1999
311.957
-102.174
-24.67%
jan 1, 2000
322.119
+10.162
3.26%
jan 1, 2001
329.351
+7.232
2.25%
jan 1, 2002
340.459
+11.108
3.37%
jan 1, 2003
269.161
-71.298
-20.94%
jan 1, 2004
275.417
+6.256
2.32%
jan 1, 2005
411.928
+136.511
49.57%
jan 1, 2006
421.368
+9.439
2.29%
jan 1, 2007
470.841
+49.473
11.74%
jan 1, 2008
502.498
+31.658
6.72%
jan 1, 2009
544.076
+41.577
8.27%
Ranking of countries by current statistics by years


Comments: