29
/
en
AIzaSyAYiBZKx7MnpbEhh9jyipgxe19OcubqV5w
April 1, 2024
83075
Belize
BLZ
true
2
1
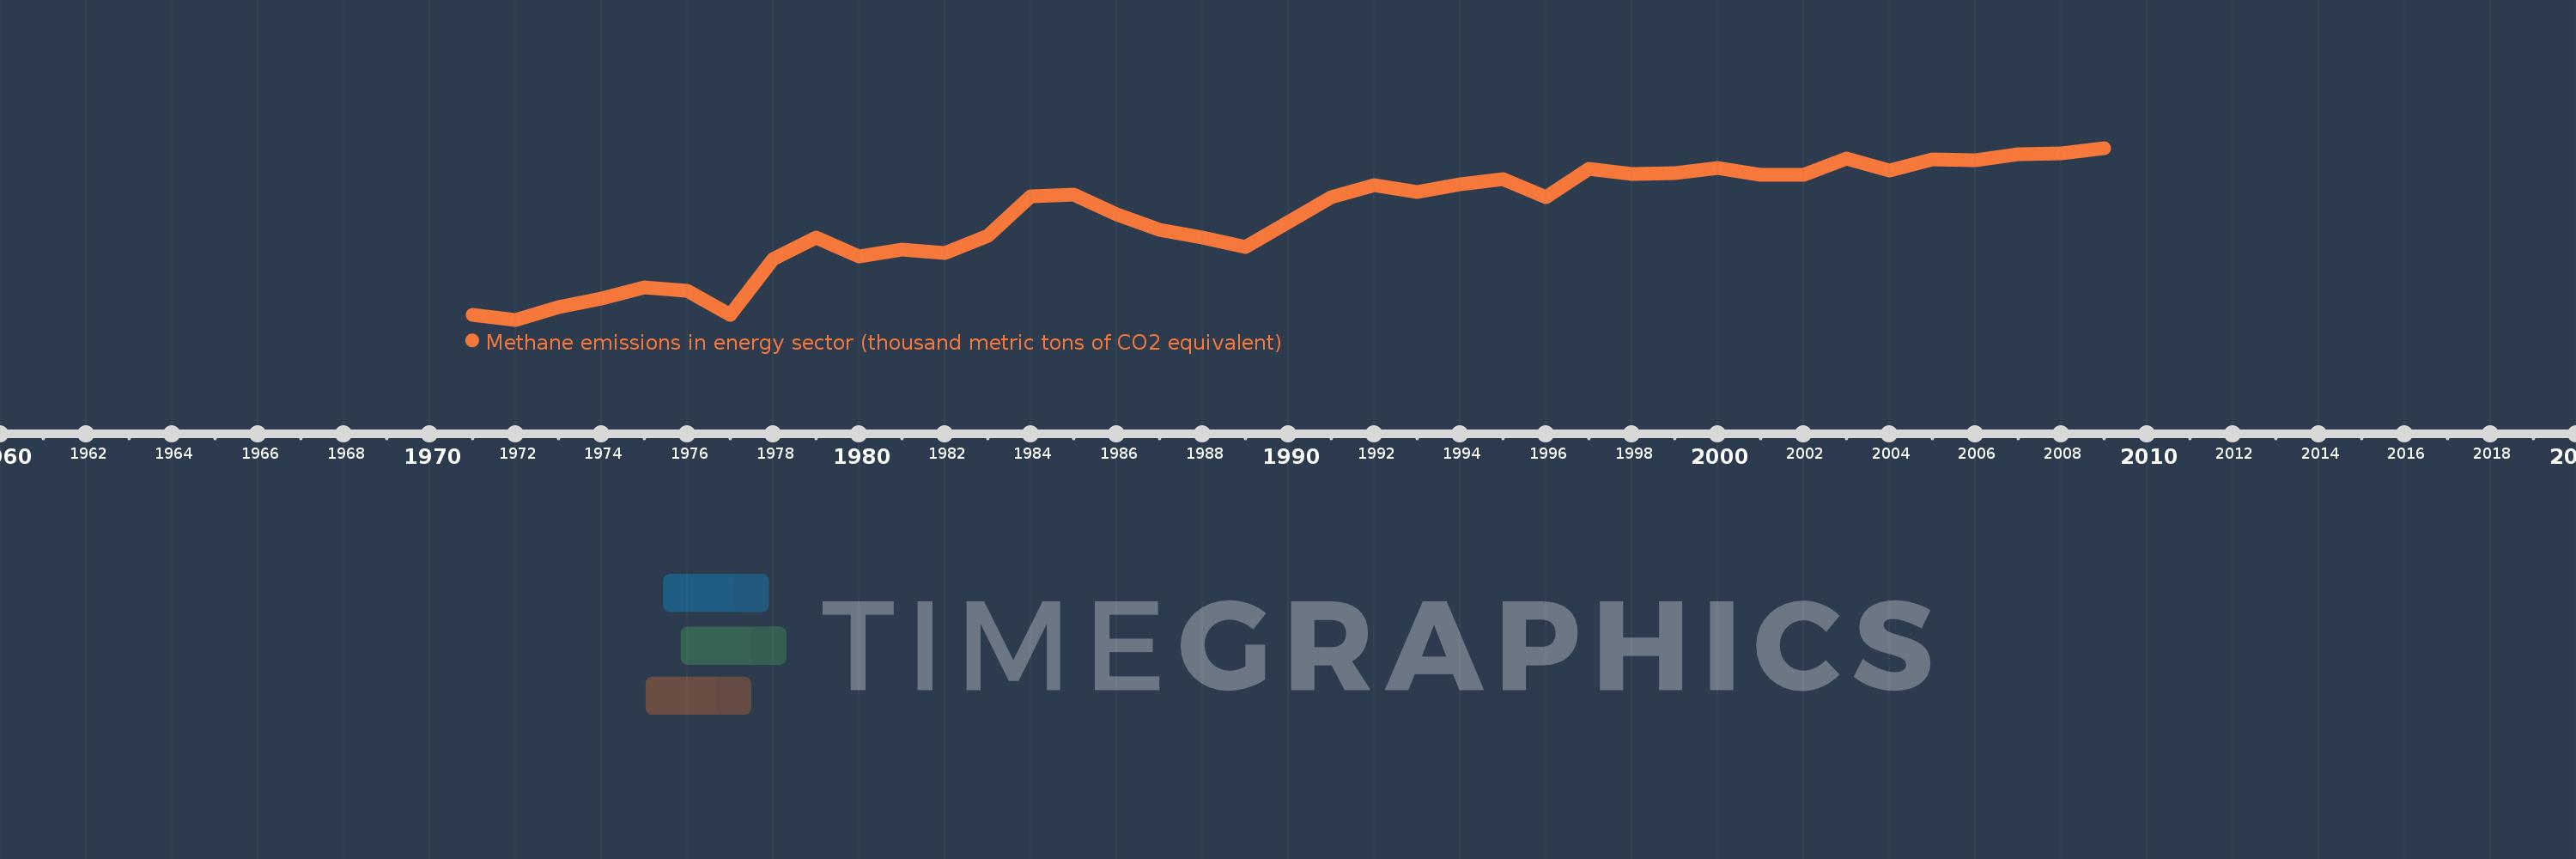
Methane emissions in energy sector (thousand metric tons of CO2 equivalent)
2009,2008,2007,2006,2005,2004,2003,2002,2001,2000,1999,1998,1997,1996,1995,1994,1993,1992,1991,1990,1989,1988,1987,1986,1985,1984,1983,1982,1981,1980,1979,1978,1977,1976,1975,1974,1973,1972,1971
This statistics in other country:
AfghanistanAlbaniaAlgeriaAmerican SamoaAndorraAngolaAntigua and BarbudaArab WorldArgentinaArmeniaArubaAustraliaAustriaAzerbaijanBahamas, TheBahrainBangladeshBarbadosBelarusBelgiumBelizeBeninBermudaBhutanBoliviaBosnia and HerzegovinaBotswanaBrazilBritish Virgin IslandsBrunei DarussalamBulgariaBurkina FasoBurundiCabo VerdeCambodiaCameroonCanadaCaribbean small statesCayman IslandsCentral African RepublicCentral Europe and the BalticsChadChannel IslandsChileChinaColombiaComorosCongo, Dem. Rep.Congo, Rep.Costa RicaCote d'IvoireCroatiaCubaCuracaoCyprusCzech RepublicDenmarkDjiboutiDominicaDominican RepublicEarly-demographic dividendEast Asia & PacificEast Asia & Pacific (excluding high income)East Asia & Pacific (IDA & IBRD countries)EcuadorEgypt, Arab Rep.El SalvadorEquatorial GuineaEritreaEstoniaEthiopiaEuro areaEurope & Central AsiaEurope & Central Asia (excluding high income)Europe & Central Asia (IDA & IBRD countries)European UnionFaroe IslandsFijiFinlandFragile and conflict affected situationsFranceFrench PolynesiaGabonGambia, TheGeorgiaGermanyGhanaGibraltarGreeceGreenlandGrenadaGuamGuatemalaGuineaGuinea-BissauGuyanaHaitiHeavily indebted poor countries (HIPC)High incomeHondurasHong Kong SAR, ChinaHungaryIBRD onlyIcelandIDA & IBRD totalIDA blendIDA onlyIDA totalIndiaIndonesiaIran, Islamic Rep.IraqIrelandIsle of ManIsraelItalyJamaicaJapanJordanKazakhstanKenyaKiribatiKorea, Dem. People’s Rep.Korea, Rep.KosovoKuwaitKyrgyz RepublicLao PDRLate-demographic dividendLatin America & Caribbean Latin America & Caribbean (excluding high income)Latin America & the Caribbean (IDA & IBRD countries)LatviaLeast developed countries: UN classificationLebanonLesothoLiberiaLibyaLiechtensteinLithuaniaLow & middle incomeLow incomeLower middle incomeLuxembourgMacao SAR, ChinaMacedonia, FYRMadagascarMalawiMalaysiaMaldivesMaliMaltaMarshall IslandsMauritaniaMauritiusMexicoMicronesia, Fed. Sts.Middle East & North AfricaMiddle East & North Africa (excluding high income)Middle East & North Africa (IDA & IBRD countries)Middle incomeMoldovaMonacoMongoliaMontenegroMoroccoMozambiqueMyanmarNamibiaNauruNepalNetherlandsNew CaledoniaNew ZealandNicaraguaNigerNigeriaNorth AmericaNorthern Mariana IslandsNorwayOECD membersOmanOther small statesPacific island small statesPakistanPalauPanamaPapua New GuineaParaguayPeruPhilippinesPolandPortugalPost-demographic dividendPre-demographic dividendPuerto RicoQatarRomaniaRussian FederationRwandaSamoaSan MarinoSao Tome and PrincipeSaudi ArabiaSenegalSerbiaSeychellesSierra LeoneSingaporeSint Maarten (Dutch part)Slovak RepublicSloveniaSmall statesSolomon IslandsSomaliaSouth AfricaSouth AsiaSouth Asia (IDA & IBRD)South SudanSpainSri LankaSt. Kitts and NevisSt. LuciaSt. Martin (French part)St. Vincent and the GrenadinesSub-Saharan Africa Sub-Saharan Africa (excluding high income)Sub-Saharan Africa (IDA & IBRD countries)SudanSurinameSwazilandSwedenSwitzerlandSyrian Arab RepublicTajikistanTanzaniaThailandTimor-LesteTogoTongaTrinidad and TobagoTunisiaTurkeyTurkmenistanTurks and Caicos IslandsTuvaluUgandaUkraineUnited Arab EmiratesUnited KingdomUnited StatesUpper middle incomeUruguayUzbekistanVanuatuVenezuela, RBVietnamVirgin Islands (U.S.)West Bank and GazaWorldYemen, Rep.ZambiaZimbabwe Timeline:
This timeline shows a graph from 1971 to 2009 of Belize. No data until 1970. Number of actual observations by date: 39.
Source name:
World Development Indicators
Source organization:
European Commission, Joint Research Centre (JRC)/Netherlands Environmental Assessment Agency (PBL). Emission Database for Global Atmospheric Research (EDGAR): http://edgar.jrc.ec.europa.eu/
Categories, topics:
Energy & Mining, Environment
Last updated:
apr 23, 2017
Indicators value changes by year
Minimum:
14.353
jan 1, 1972
Maximum:
25.972
jan 1, 2009
At the date of observation
Value
Absolute change
Change from previous value
jan 1, 1971
14.706
+14.706
0.0%
jan 1, 1972
14.353
-0.354
-2.41%
jan 1, 1973
15.209
+0.856
5.96%
jan 1, 1974
15.774
+0.565
3.72%
jan 1, 1975
16.521
+0.747
4.74%
jan 1, 1976
16.304
-0.218
-1.32%
jan 1, 1977
14.669
-1.635
-10.03%
jan 1, 1978
18.479
+3.811
25.98%
jan 1, 1979
19.898
+1.418
7.67%
jan 1, 1980
18.638
-1.26
-6.33%
jan 1, 1981
19.115
+0.477
2.56%
jan 1, 1982
18.873
-0.242
-1.27%
jan 1, 1983
20.028
+1.155
6.12%
jan 1, 1984
22.716
+2.687
13.42%
jan 1, 1985
22.828
+0.113
0.5%
jan 1, 1986
21.458
-1.371
-6.0%
jan 1, 1987
20.44
-1.018
-4.74%
jan 1, 1988
19.934
-0.505
-2.47%
jan 1, 1989
19.275
-0.659
-3.31%
jan 1, 1990
20.945
+1.67
8.66%
jan 1, 1991
22.62
+1.676
8.0%
jan 1, 1992
23.445
+0.824
3.64%
jan 1, 1993
22.997
-0.447
-1.91%
jan 1, 1994
23.497
+0.5
2.17%
jan 1, 1995
23.867
+0.37
1.57%
jan 1, 1996
22.644
-1.223
-5.12%
jan 1, 1997
24.589
+1.945
8.59%
jan 1, 1998
24.195
-0.393
-1.6%
jan 1, 1999
24.267
+0.072
0.3%
jan 1, 2000
24.634
+0.367
1.51%
jan 1, 2001
24.179
-0.456
-1.85%
jan 1, 2002
24.167
-0.012
-0.05%
jan 1, 2003
25.258
+1.091
4.52%
jan 1, 2004
24.442
-0.816
-3.23%
jan 1, 2005
25.173
+0.731
2.99%
jan 1, 2006
25.168
-0.005
-0.02%
jan 1, 2007
25.522
+0.354
1.41%
jan 1, 2008
25.615
+0.094
0.37%
jan 1, 2009
25.972
+0.357
1.39%
Ranking of countries by current statistics by years


Comments: