29
/
en
AIzaSyAYiBZKx7MnpbEhh9jyipgxe19OcubqV5w
April 1, 2024
284917
Yemen, Rep.
YEM
true
2
1
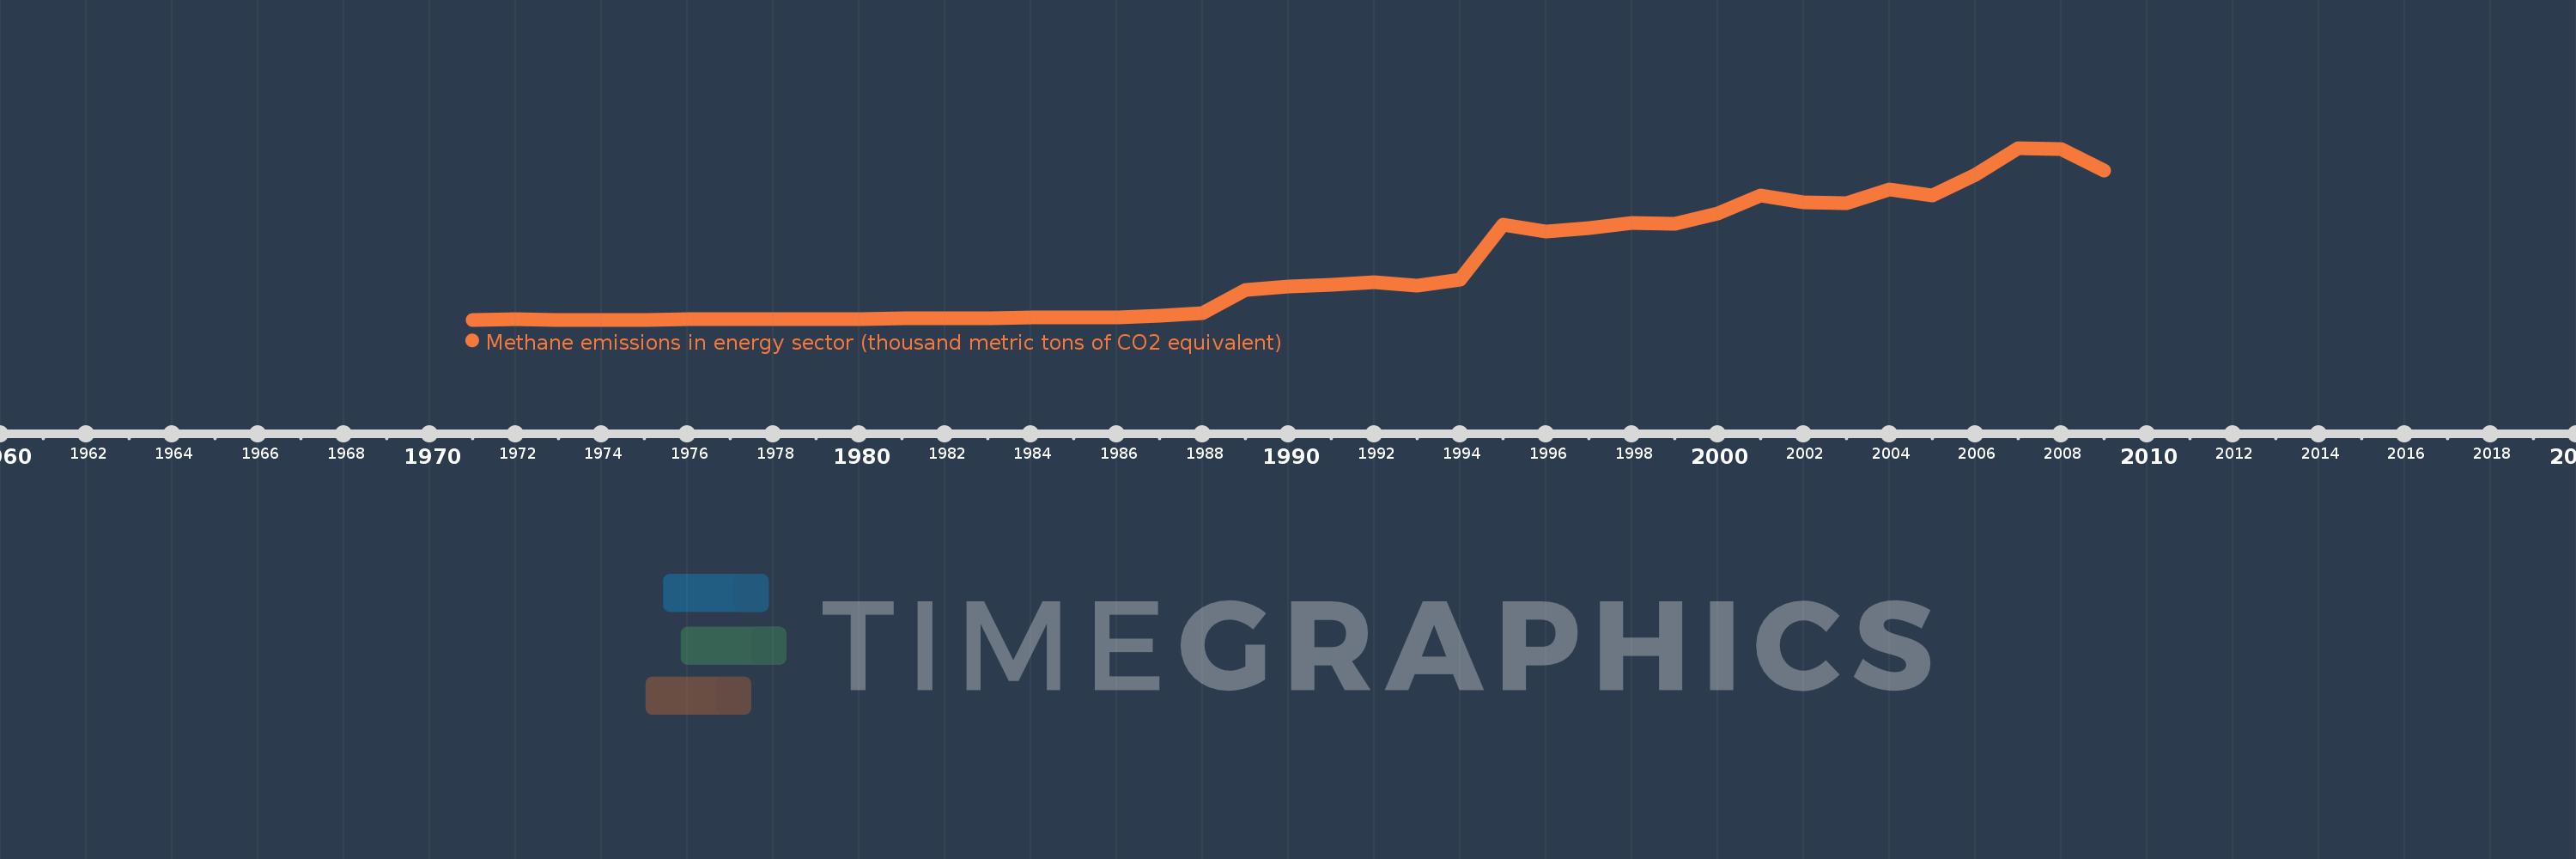
Methane emissions in energy sector (thousand metric tons of CO2 equivalent)
2009,2008,2007,2006,2005,2004,2003,2002,2001,2000,1999,1998,1997,1996,1995,1994,1993,1992,1991,1990,1989,1988,1987,1986,1985,1984,1983,1982,1981,1980,1979,1978,1977,1976,1975,1974,1973,1972,1971
This statistics in other country:
AfghanistanAlbaniaAlgeriaAmerican SamoaAndorraAngolaAntigua and BarbudaArab WorldArgentinaArmeniaArubaAustraliaAustriaAzerbaijanBahamas, TheBahrainBangladeshBarbadosBelarusBelgiumBelizeBeninBermudaBhutanBoliviaBosnia and HerzegovinaBotswanaBrazilBritish Virgin IslandsBrunei DarussalamBulgariaBurkina FasoBurundiCabo VerdeCambodiaCameroonCanadaCaribbean small statesCayman IslandsCentral African RepublicCentral Europe and the BalticsChadChannel IslandsChileChinaColombiaComorosCongo, Dem. Rep.Congo, Rep.Costa RicaCote d'IvoireCroatiaCubaCuracaoCyprusCzech RepublicDenmarkDjiboutiDominicaDominican RepublicEarly-demographic dividendEast Asia & PacificEast Asia & Pacific (excluding high income)East Asia & Pacific (IDA & IBRD countries)EcuadorEgypt, Arab Rep.El SalvadorEquatorial GuineaEritreaEstoniaEthiopiaEuro areaEurope & Central AsiaEurope & Central Asia (excluding high income)Europe & Central Asia (IDA & IBRD countries)European UnionFaroe IslandsFijiFinlandFragile and conflict affected situationsFranceFrench PolynesiaGabonGambia, TheGeorgiaGermanyGhanaGibraltarGreeceGreenlandGrenadaGuamGuatemalaGuineaGuinea-BissauGuyanaHaitiHeavily indebted poor countries (HIPC)High incomeHondurasHong Kong SAR, ChinaHungaryIBRD onlyIcelandIDA & IBRD totalIDA blendIDA onlyIDA totalIndiaIndonesiaIran, Islamic Rep.IraqIrelandIsle of ManIsraelItalyJamaicaJapanJordanKazakhstanKenyaKiribatiKorea, Dem. People’s Rep.Korea, Rep.KosovoKuwaitKyrgyz RepublicLao PDRLate-demographic dividendLatin America & Caribbean Latin America & Caribbean (excluding high income)Latin America & the Caribbean (IDA & IBRD countries)LatviaLeast developed countries: UN classificationLebanonLesothoLiberiaLibyaLiechtensteinLithuaniaLow & middle incomeLow incomeLower middle incomeLuxembourgMacao SAR, ChinaMacedonia, FYRMadagascarMalawiMalaysiaMaldivesMaliMaltaMarshall IslandsMauritaniaMauritiusMexicoMicronesia, Fed. Sts.Middle East & North AfricaMiddle East & North Africa (excluding high income)Middle East & North Africa (IDA & IBRD countries)Middle incomeMoldovaMonacoMongoliaMontenegroMoroccoMozambiqueMyanmarNamibiaNauruNepalNetherlandsNew CaledoniaNew ZealandNicaraguaNigerNigeriaNorth AmericaNorthern Mariana IslandsNorwayOECD membersOmanOther small statesPacific island small statesPakistanPalauPanamaPapua New GuineaParaguayPeruPhilippinesPolandPortugalPost-demographic dividendPre-demographic dividendPuerto RicoQatarRomaniaRussian FederationRwandaSamoaSan MarinoSao Tome and PrincipeSaudi ArabiaSenegalSerbiaSeychellesSierra LeoneSingaporeSint Maarten (Dutch part)Slovak RepublicSloveniaSmall statesSolomon IslandsSomaliaSouth AfricaSouth AsiaSouth Asia (IDA & IBRD)South SudanSpainSri LankaSt. Kitts and NevisSt. LuciaSt. Martin (French part)St. Vincent and the GrenadinesSub-Saharan Africa Sub-Saharan Africa (excluding high income)Sub-Saharan Africa (IDA & IBRD countries)SudanSurinameSwazilandSwedenSwitzerlandSyrian Arab RepublicTajikistanTanzaniaThailandTimor-LesteTogoTongaTrinidad and TobagoTunisiaTurkeyTurkmenistanTurks and Caicos IslandsTuvaluUgandaUkraineUnited Arab EmiratesUnited KingdomUnited StatesUpper middle incomeUruguayUzbekistanVanuatuVenezuela, RBVietnamVirgin Islands (U.S.)West Bank and GazaWorldYemen, Rep.ZambiaZimbabwe Timeline:
This timeline shows a graph from 1971 to 2009 of Yemen, Rep.. No data until 1970. Number of actual observations by date: 39.
Source name:
World Development Indicators
Source organization:
European Commission, Joint Research Centre (JRC)/Netherlands Environmental Assessment Agency (PBL). Emission Database for Global Atmospheric Research (EDGAR): http://edgar.jrc.ec.europa.eu/
Categories, topics:
Energy & Mining, Environment
Last updated:
apr 23, 2017
Indicators value changes by year
Minimum:
155.369
jan 1, 1973
Maximum:
2.636K
jan 1, 2007
At the date of observation
Value
Absolute change
Change from previous value
jan 1, 1971
156.592
+156.592
0.0%
jan 1, 1972
158.25
+1.658
1.06%
jan 1, 1973
155.369
-2.881
-1.82%
jan 1, 1974
157.144
+1.775
1.14%
jan 1, 1975
156.634
-0.51
-0.32%
jan 1, 1976
161.031
+4.396
2.81%
jan 1, 1977
161.417
+0.387
0.24%
jan 1, 1978
160.737
-0.681
-0.42%
jan 1, 1979
161.174
+0.437
0.27%
jan 1, 1980
162.144
+0.971
0.6%
jan 1, 1981
174.969
+12.824
7.91%
jan 1, 1982
174.97
+0.002
0.0%
jan 1, 1983
180.861
+5.891
3.37%
jan 1, 1984
184.88
+4.019
2.22%
jan 1, 1985
189.681
+4.801
2.6%
jan 1, 1986
191.839
+2.158
1.14%
jan 1, 1987
214.389
+22.55
11.75%
jan 1, 1988
246.876
+32.487
15.15%
jan 1, 1989
581.872
+334.996
135.69%
jan 1, 1990
633.144
+51.272
8.81%
jan 1, 1991
663.698
+30.554
4.83%
jan 1, 1992
700.348
+36.649
5.52%
jan 1, 1993
652.278
-48.069
-6.86%
jan 1, 1994
734.798
+82.52
12.65%
jan 1, 1995
1.528K
+793.442
107.98%
jan 1, 1996
1.432K
-96.543
-6.32%
jan 1, 1997
1.474K
+42.574
2.97%
jan 1, 1998
1.558K
+83.395
5.66%
jan 1, 1999
1.538K
-20.135
-1.29%
jan 1, 2000
1.694K
+156.688
10.19%
jan 1, 2001
1.947K
+252.895
14.93%
jan 1, 2002
1.857K
-90.203
-4.63%
jan 1, 2003
1.843K
-13.924
-0.75%
jan 1, 2004
2.038K
+195.014
10.58%
jan 1, 2005
1.948K
-90.266
-4.43%
jan 1, 2006
2.244K
+296.108
15.2%
jan 1, 2007
2.636K
+392.169
17.48%
jan 1, 2008
2.622K
-13.725
-0.52%
jan 1, 2009
2.312K
-309.865
-11.82%
Ranking of countries by current statistics by years


Comments: