29
/
en
AIzaSyAYiBZKx7MnpbEhh9jyipgxe19OcubqV5w
April 1, 2024
221143
Paraguay
PRY
true
2
1
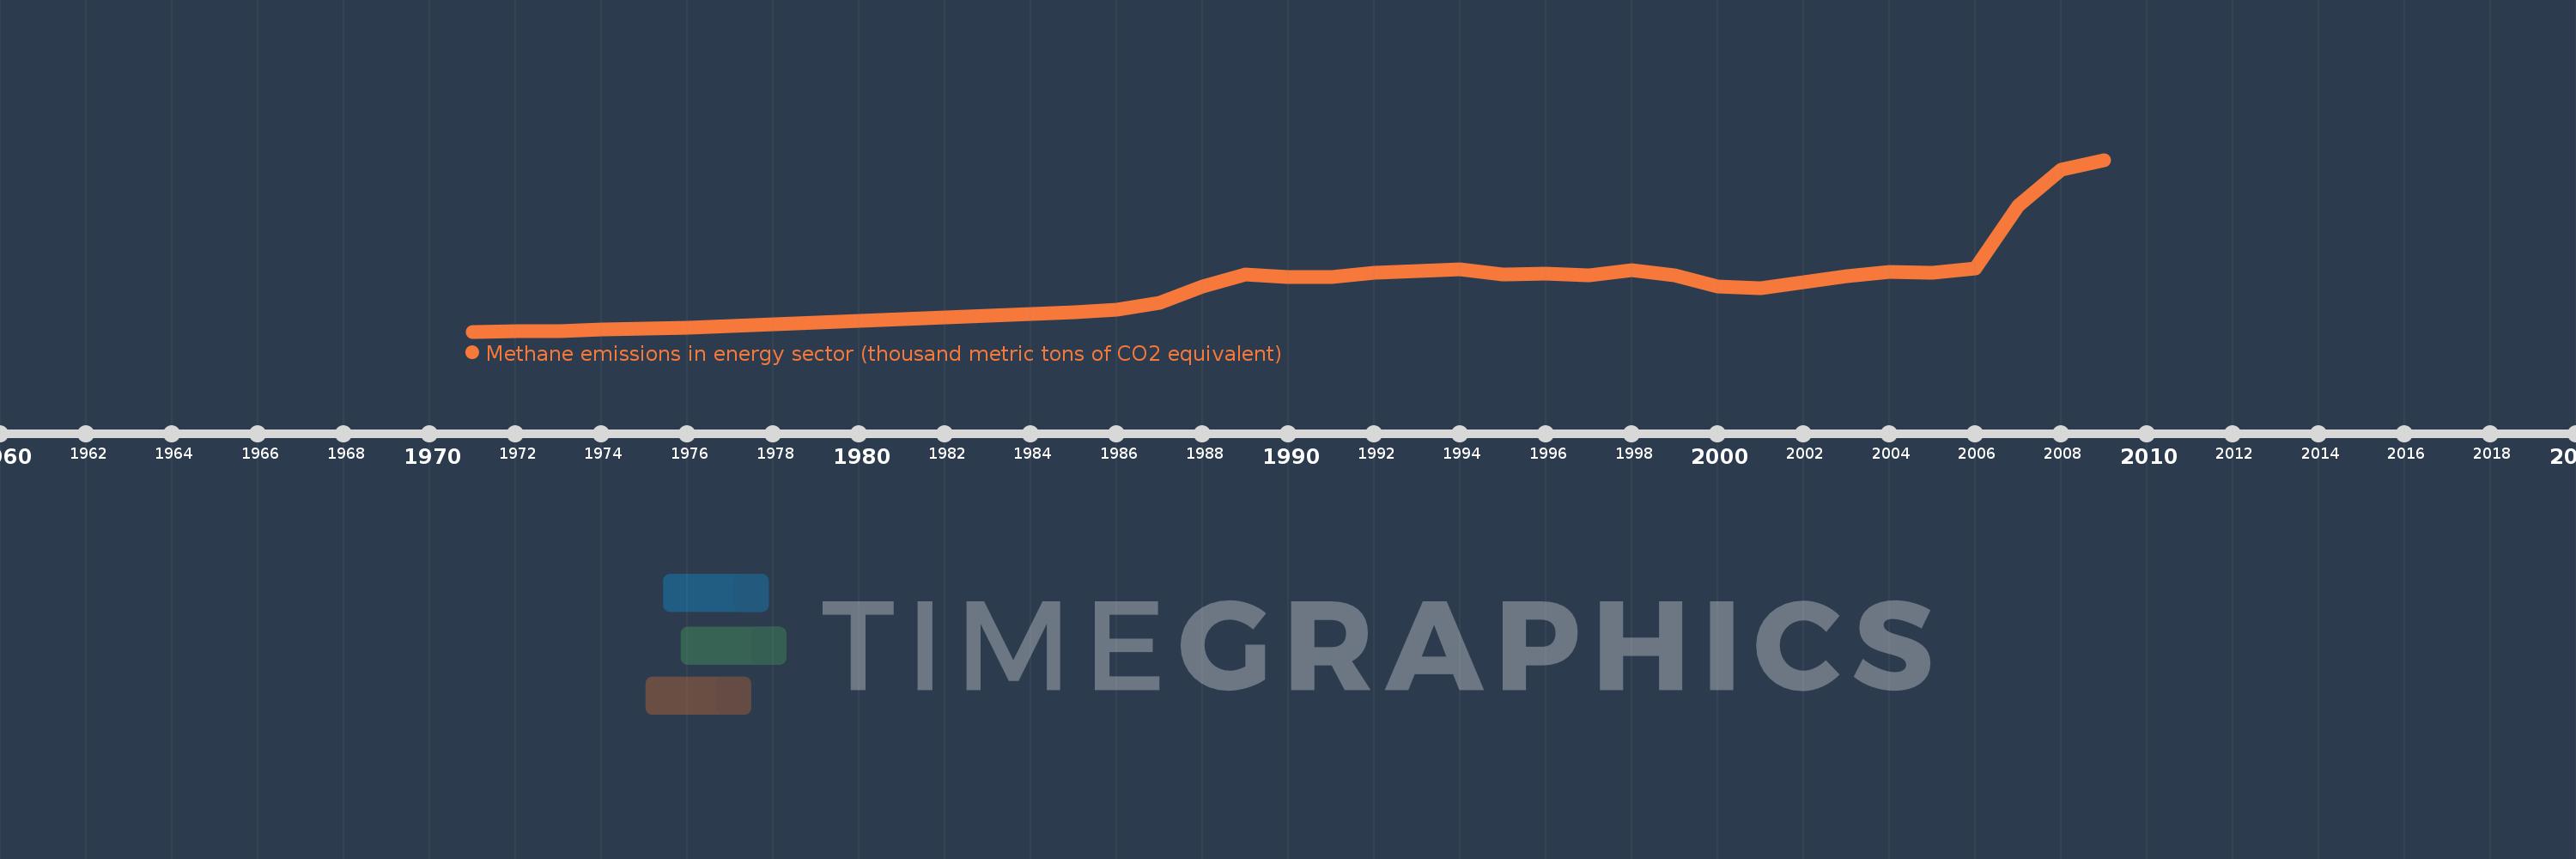
Methane emissions in energy sector (thousand metric tons of CO2 equivalent)
2009,2008,2007,2006,2005,2004,2003,2002,2001,2000,1999,1998,1997,1996,1995,1994,1993,1992,1991,1990,1989,1988,1987,1986,1985,1984,1983,1982,1981,1980,1979,1978,1977,1976,1975,1974,1973,1972,1971
This statistics in other country:
AfghanistanAlbaniaAlgeriaAmerican SamoaAndorraAngolaAntigua and BarbudaArab WorldArgentinaArmeniaArubaAustraliaAustriaAzerbaijanBahamas, TheBahrainBangladeshBarbadosBelarusBelgiumBelizeBeninBermudaBhutanBoliviaBosnia and HerzegovinaBotswanaBrazilBritish Virgin IslandsBrunei DarussalamBulgariaBurkina FasoBurundiCabo VerdeCambodiaCameroonCanadaCaribbean small statesCayman IslandsCentral African RepublicCentral Europe and the BalticsChadChannel IslandsChileChinaColombiaComorosCongo, Dem. Rep.Congo, Rep.Costa RicaCote d'IvoireCroatiaCubaCuracaoCyprusCzech RepublicDenmarkDjiboutiDominicaDominican RepublicEarly-demographic dividendEast Asia & PacificEast Asia & Pacific (excluding high income)East Asia & Pacific (IDA & IBRD countries)EcuadorEgypt, Arab Rep.El SalvadorEquatorial GuineaEritreaEstoniaEthiopiaEuro areaEurope & Central AsiaEurope & Central Asia (excluding high income)Europe & Central Asia (IDA & IBRD countries)European UnionFaroe IslandsFijiFinlandFragile and conflict affected situationsFranceFrench PolynesiaGabonGambia, TheGeorgiaGermanyGhanaGibraltarGreeceGreenlandGrenadaGuamGuatemalaGuineaGuinea-BissauGuyanaHaitiHeavily indebted poor countries (HIPC)High incomeHondurasHong Kong SAR, ChinaHungaryIBRD onlyIcelandIDA & IBRD totalIDA blendIDA onlyIDA totalIndiaIndonesiaIran, Islamic Rep.IraqIrelandIsle of ManIsraelItalyJamaicaJapanJordanKazakhstanKenyaKiribatiKorea, Dem. People’s Rep.Korea, Rep.KosovoKuwaitKyrgyz RepublicLao PDRLate-demographic dividendLatin America & Caribbean Latin America & Caribbean (excluding high income)Latin America & the Caribbean (IDA & IBRD countries)LatviaLeast developed countries: UN classificationLebanonLesothoLiberiaLibyaLiechtensteinLithuaniaLow & middle incomeLow incomeLower middle incomeLuxembourgMacao SAR, ChinaMacedonia, FYRMadagascarMalawiMalaysiaMaldivesMaliMaltaMarshall IslandsMauritaniaMauritiusMexicoMicronesia, Fed. Sts.Middle East & North AfricaMiddle East & North Africa (excluding high income)Middle East & North Africa (IDA & IBRD countries)Middle incomeMoldovaMonacoMongoliaMontenegroMoroccoMozambiqueMyanmarNamibiaNauruNepalNetherlandsNew CaledoniaNew ZealandNicaraguaNigerNigeriaNorth AmericaNorthern Mariana IslandsNorwayOECD membersOmanOther small statesPacific island small statesPakistanPalauPanamaPapua New GuineaParaguayPeruPhilippinesPolandPortugalPost-demographic dividendPre-demographic dividendPuerto RicoQatarRomaniaRussian FederationRwandaSamoaSan MarinoSao Tome and PrincipeSaudi ArabiaSenegalSerbiaSeychellesSierra LeoneSingaporeSint Maarten (Dutch part)Slovak RepublicSloveniaSmall statesSolomon IslandsSomaliaSouth AfricaSouth AsiaSouth Asia (IDA & IBRD)South SudanSpainSri LankaSt. Kitts and NevisSt. LuciaSt. Martin (French part)St. Vincent and the GrenadinesSub-Saharan Africa Sub-Saharan Africa (excluding high income)Sub-Saharan Africa (IDA & IBRD countries)SudanSurinameSwazilandSwedenSwitzerlandSyrian Arab RepublicTajikistanTanzaniaThailandTimor-LesteTogoTongaTrinidad and TobagoTunisiaTurkeyTurkmenistanTurks and Caicos IslandsTuvaluUgandaUkraineUnited Arab EmiratesUnited KingdomUnited StatesUpper middle incomeUruguayUzbekistanVanuatuVenezuela, RBVietnamVirgin Islands (U.S.)West Bank and GazaWorldYemen, Rep.ZambiaZimbabwe Timeline:
This timeline shows a graph from 1971 to 2009 of Paraguay. No data until 1970. Number of actual observations by date: 39.
Source name:
World Development Indicators
Source organization:
European Commission, Joint Research Centre (JRC)/Netherlands Environmental Assessment Agency (PBL). Emission Database for Global Atmospheric Research (EDGAR): http://edgar.jrc.ec.europa.eu/
Categories, topics:
Energy & Mining, Environment
Last updated:
apr 23, 2017
Indicators value changes by year
Minimum:
368.599
jan 1, 1971
Maximum:
1.791K
jan 1, 2009
At the date of observation
Value
Absolute change
Change from previous value
jan 1, 1971
368.599
+368.599
0.0%
jan 1, 1972
369.127
+0.528
0.14%
jan 1, 1973
374.593
+5.465
1.48%
jan 1, 1974
384.485
+9.892
2.64%
jan 1, 1975
395.498
+11.013
2.86%
jan 1, 1976
402.486
+6.988
1.77%
jan 1, 1977
416.71
+14.224
3.53%
jan 1, 1978
429.709
+12.999
3.12%
jan 1, 1979
442.287
+12.578
2.93%
jan 1, 1980
456.704
+14.417
3.26%
jan 1, 1981
471.669
+14.965
3.28%
jan 1, 1982
488.747
+17.078
3.62%
jan 1, 1983
503.572
+14.826
3.03%
jan 1, 1984
516.956
+13.384
2.66%
jan 1, 1985
529.71
+12.754
2.47%
jan 1, 1986
547.692
+17.982
3.39%
jan 1, 1987
605.531
+57.839
10.56%
jan 1, 1988
744.349
+138.818
22.92%
jan 1, 1989
843.472
+99.123
13.32%
jan 1, 1990
819.666
-23.805
-2.82%
jan 1, 1991
821.726
+2.059
0.25%
jan 1, 1992
855.908
+34.182
4.16%
jan 1, 1993
873.293
+17.385
2.03%
jan 1, 1994
885.604
+12.311
1.41%
jan 1, 1995
838.127
-47.477
-5.36%
jan 1, 1996
846.104
+7.977
0.95%
jan 1, 1997
832.019
-14.085
-1.66%
jan 1, 1998
874.614
+42.596
5.12%
jan 1, 1999
833.718
-40.896
-4.68%
jan 1, 2000
743.019
-90.699
-10.88%
jan 1, 2001
730.298
-12.722
-1.71%
jan 1, 2002
777.316
+47.019
6.44%
jan 1, 2003
829.872
+52.556
6.76%
jan 1, 2004
864.733
+34.861
4.2%
jan 1, 2005
858.301
-6.432
-0.74%
jan 1, 2006
892.055
+33.754
3.93%
jan 1, 2007
1.409K
+516.533
57.9%
jan 1, 2008
1.708K
+299.752
21.28%
jan 1, 2009
1.791K
+82.544
4.83%
Ranking of countries by current statistics by years


Comments: