29
/
en
AIzaSyAYiBZKx7MnpbEhh9jyipgxe19OcubqV5w
April 1, 2024
55726
Pre-demographic dividend
PRE
false
2
1
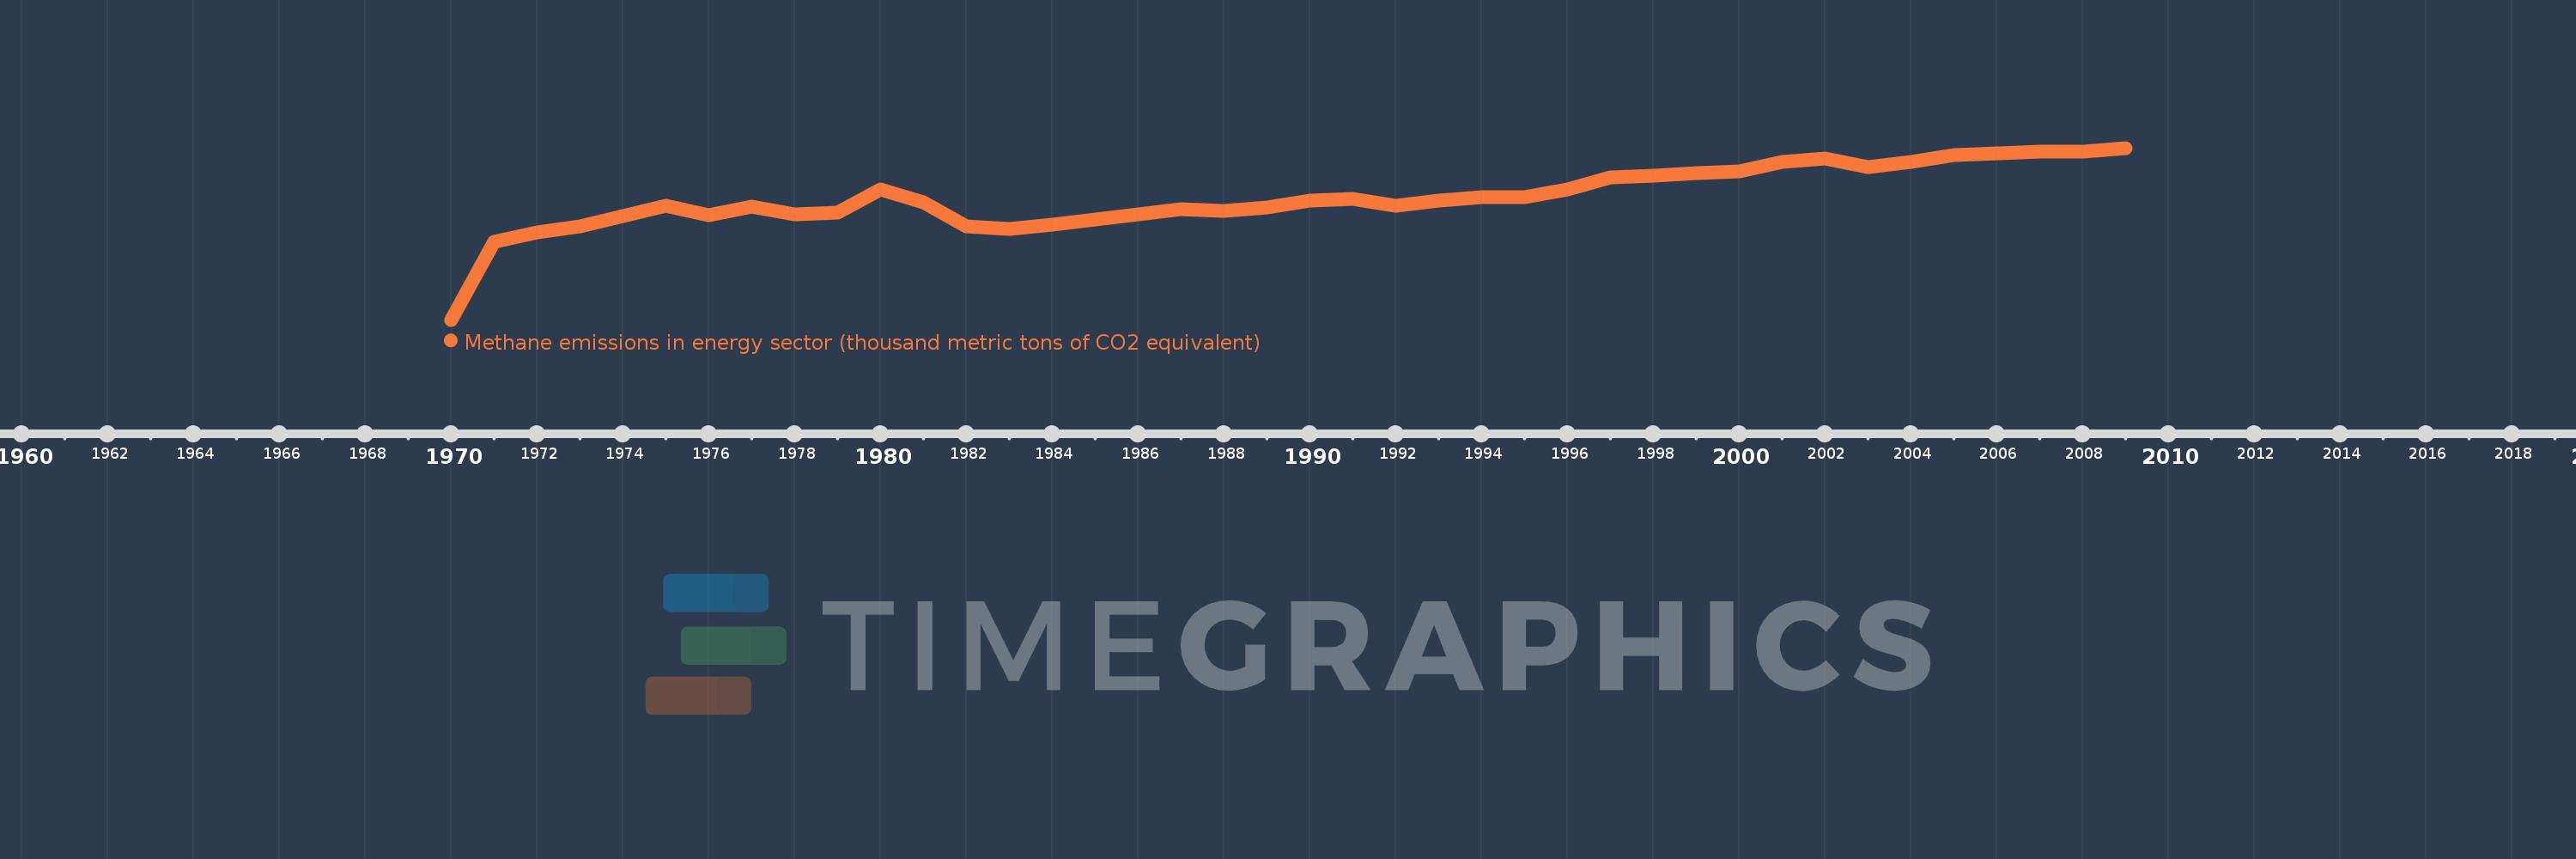
Methane emissions in energy sector (thousand metric tons of CO2 equivalent)
2009,2008,2007,2006,2005,2004,2003,2002,2001,2000,1999,1998,1997,1996,1995,1994,1993,1992,1991,1990,1989,1988,1987,1986,1985,1984,1983,1982,1981,1980,1979,1978,1977,1976,1975,1974,1973,1972,1971,1970
This statistics in other country:
AfghanistanAlbaniaAlgeriaAmerican SamoaAndorraAngolaAntigua and BarbudaArab WorldArgentinaArmeniaArubaAustraliaAustriaAzerbaijanBahamas, TheBahrainBangladeshBarbadosBelarusBelgiumBelizeBeninBermudaBhutanBoliviaBosnia and HerzegovinaBotswanaBrazilBritish Virgin IslandsBrunei DarussalamBulgariaBurkina FasoBurundiCabo VerdeCambodiaCameroonCanadaCaribbean small statesCayman IslandsCentral African RepublicCentral Europe and the BalticsChadChannel IslandsChileChinaColombiaComorosCongo, Dem. Rep.Congo, Rep.Costa RicaCote d'IvoireCroatiaCubaCuracaoCyprusCzech RepublicDenmarkDjiboutiDominicaDominican RepublicEarly-demographic dividendEast Asia & PacificEast Asia & Pacific (excluding high income)East Asia & Pacific (IDA & IBRD countries)EcuadorEgypt, Arab Rep.El SalvadorEquatorial GuineaEritreaEstoniaEthiopiaEuro areaEurope & Central AsiaEurope & Central Asia (excluding high income)Europe & Central Asia (IDA & IBRD countries)European UnionFaroe IslandsFijiFinlandFragile and conflict affected situationsFranceFrench PolynesiaGabonGambia, TheGeorgiaGermanyGhanaGibraltarGreeceGreenlandGrenadaGuamGuatemalaGuineaGuinea-BissauGuyanaHaitiHeavily indebted poor countries (HIPC)High incomeHondurasHong Kong SAR, ChinaHungaryIBRD onlyIcelandIDA & IBRD totalIDA blendIDA onlyIDA totalIndiaIndonesiaIran, Islamic Rep.IraqIrelandIsle of ManIsraelItalyJamaicaJapanJordanKazakhstanKenyaKiribatiKorea, Dem. People’s Rep.Korea, Rep.KosovoKuwaitKyrgyz RepublicLao PDRLate-demographic dividendLatin America & Caribbean Latin America & Caribbean (excluding high income)Latin America & the Caribbean (IDA & IBRD countries)LatviaLeast developed countries: UN classificationLebanonLesothoLiberiaLibyaLiechtensteinLithuaniaLow & middle incomeLow incomeLower middle incomeLuxembourgMacao SAR, ChinaMacedonia, FYRMadagascarMalawiMalaysiaMaldivesMaliMaltaMarshall IslandsMauritaniaMauritiusMexicoMicronesia, Fed. Sts.Middle East & North AfricaMiddle East & North Africa (excluding high income)Middle East & North Africa (IDA & IBRD countries)Middle incomeMoldovaMonacoMongoliaMontenegroMoroccoMozambiqueMyanmarNamibiaNauruNepalNetherlandsNew CaledoniaNew ZealandNicaraguaNigerNigeriaNorth AmericaNorthern Mariana IslandsNorwayOECD membersOmanOther small statesPacific island small statesPakistanPalauPanamaPapua New GuineaParaguayPeruPhilippinesPolandPortugalPost-demographic dividendPre-demographic dividendPuerto RicoQatarRomaniaRussian FederationRwandaSamoaSan MarinoSao Tome and PrincipeSaudi ArabiaSenegalSerbiaSeychellesSierra LeoneSingaporeSint Maarten (Dutch part)Slovak RepublicSloveniaSmall statesSolomon IslandsSomaliaSouth AfricaSouth AsiaSouth Asia (IDA & IBRD)South SudanSpainSri LankaSt. Kitts and NevisSt. LuciaSt. Martin (French part)St. Vincent and the GrenadinesSub-Saharan Africa Sub-Saharan Africa (excluding high income)Sub-Saharan Africa (IDA & IBRD countries)SudanSurinameSwazilandSwedenSwitzerlandSyrian Arab RepublicTajikistanTanzaniaThailandTimor-LesteTogoTongaTrinidad and TobagoTunisiaTurkeyTurkmenistanTurks and Caicos IslandsTuvaluUgandaUkraineUnited Arab EmiratesUnited KingdomUnited StatesUpper middle incomeUruguayUzbekistanVanuatuVenezuela, RBVietnamVirgin Islands (U.S.)West Bank and GazaWorldYemen, Rep.ZambiaZimbabwe Timeline:
This timeline shows a graph from 1970 to 2009 of Pre-demographic dividend. No data until 1969. Number of actual observations by date: 40.
Source name:
World Development Indicators
Source organization:
European Commission, Joint Research Centre (JRC)/Netherlands Environmental Assessment Agency (PBL). Emission Database for Global Atmospheric Research (EDGAR): http://edgar.jrc.ec.europa.eu/
Categories, topics:
Energy & Mining, Environment
Last updated:
apr 23, 2017
Indicators value changes by year
Maximum:
142.154K
jan 1, 2009
At the date of observation
Value
Absolute change
Change from previous value
jan 1, 1971
64.678K
+64.678K
%
jan 1, 1972
72.296K
+7.618K
11.78%
jan 1, 1973
77.244K
+4.948K
6.84%
jan 1, 1974
85.518K
+8.275K
10.71%
jan 1, 1975
94.421K
+8.902K
10.41%
jan 1, 1976
86.524K
-7.896K
-8.36%
jan 1, 1977
93.928K
+7.404K
8.56%
jan 1, 1978
87.319K
-6.61K
-7.04%
jan 1, 1979
88.466K
+1.147K
1.31%
jan 1, 1980
107.522K
+19.056K
21.54%
jan 1, 1981
97.464K
-10.058K
-9.35%
jan 1, 1982
77.41K
-20.054K
-20.58%
jan 1, 1983
75.313K
-2.097K
-2.71%
jan 1, 1984
78.637K
+3.324K
4.41%
jan 1, 1985
82.993K
+4.356K
5.54%
jan 1, 1986
86.867K
+3.875K
4.67%
jan 1, 1987
91.719K
+4.852K
5.59%
jan 1, 1988
89.785K
-1.934K
-2.11%
jan 1, 1989
92.78K
+2.994K
3.34%
jan 1, 1990
98.652K
+5.872K
6.33%
jan 1, 1991
100.014K
+1.363K
1.38%
jan 1, 1992
94.542K
-5.472K
-5.47%
jan 1, 1993
98.702K
+4.16K
4.4%
jan 1, 1994
101.72K
+3.018K
3.06%
jan 1, 1995
101.489K
-230.398
-0.23%
jan 1, 1996
107.819K
+6.329K
6.24%
jan 1, 1997
117.667K
+9.848K
9.13%
jan 1, 1998
119.149K
+1.482K
1.26%
jan 1, 1999
121.571K
+2.422K
2.03%
jan 1, 2000
122.729K
+1.159K
0.95%
jan 1, 2001
130.313K
+7.584K
6.18%
jan 1, 2002
133.202K
+2.888K
2.22%
jan 1, 2003
126.194K
-7.008K
-5.26%
jan 1, 2004
130.891K
+4.698K
3.72%
jan 1, 2005
136.45K
+5.559K
4.25%
jan 1, 2006
137.653K
+1.203K
0.88%
jan 1, 2007
138.947K
+1.294K
0.94%
jan 1, 2008
139.306K
+358.287
0.26%
jan 1, 2009
142.154K
+2.848K
2.04%
Ranking of countries by current statistics by years


Comments: