29
/
en
AIzaSyAYiBZKx7MnpbEhh9jyipgxe19OcubqV5w
April 1, 2024
50232
Middle East & North Africa (IDA & IBRD countries)
TMN
false
2
1
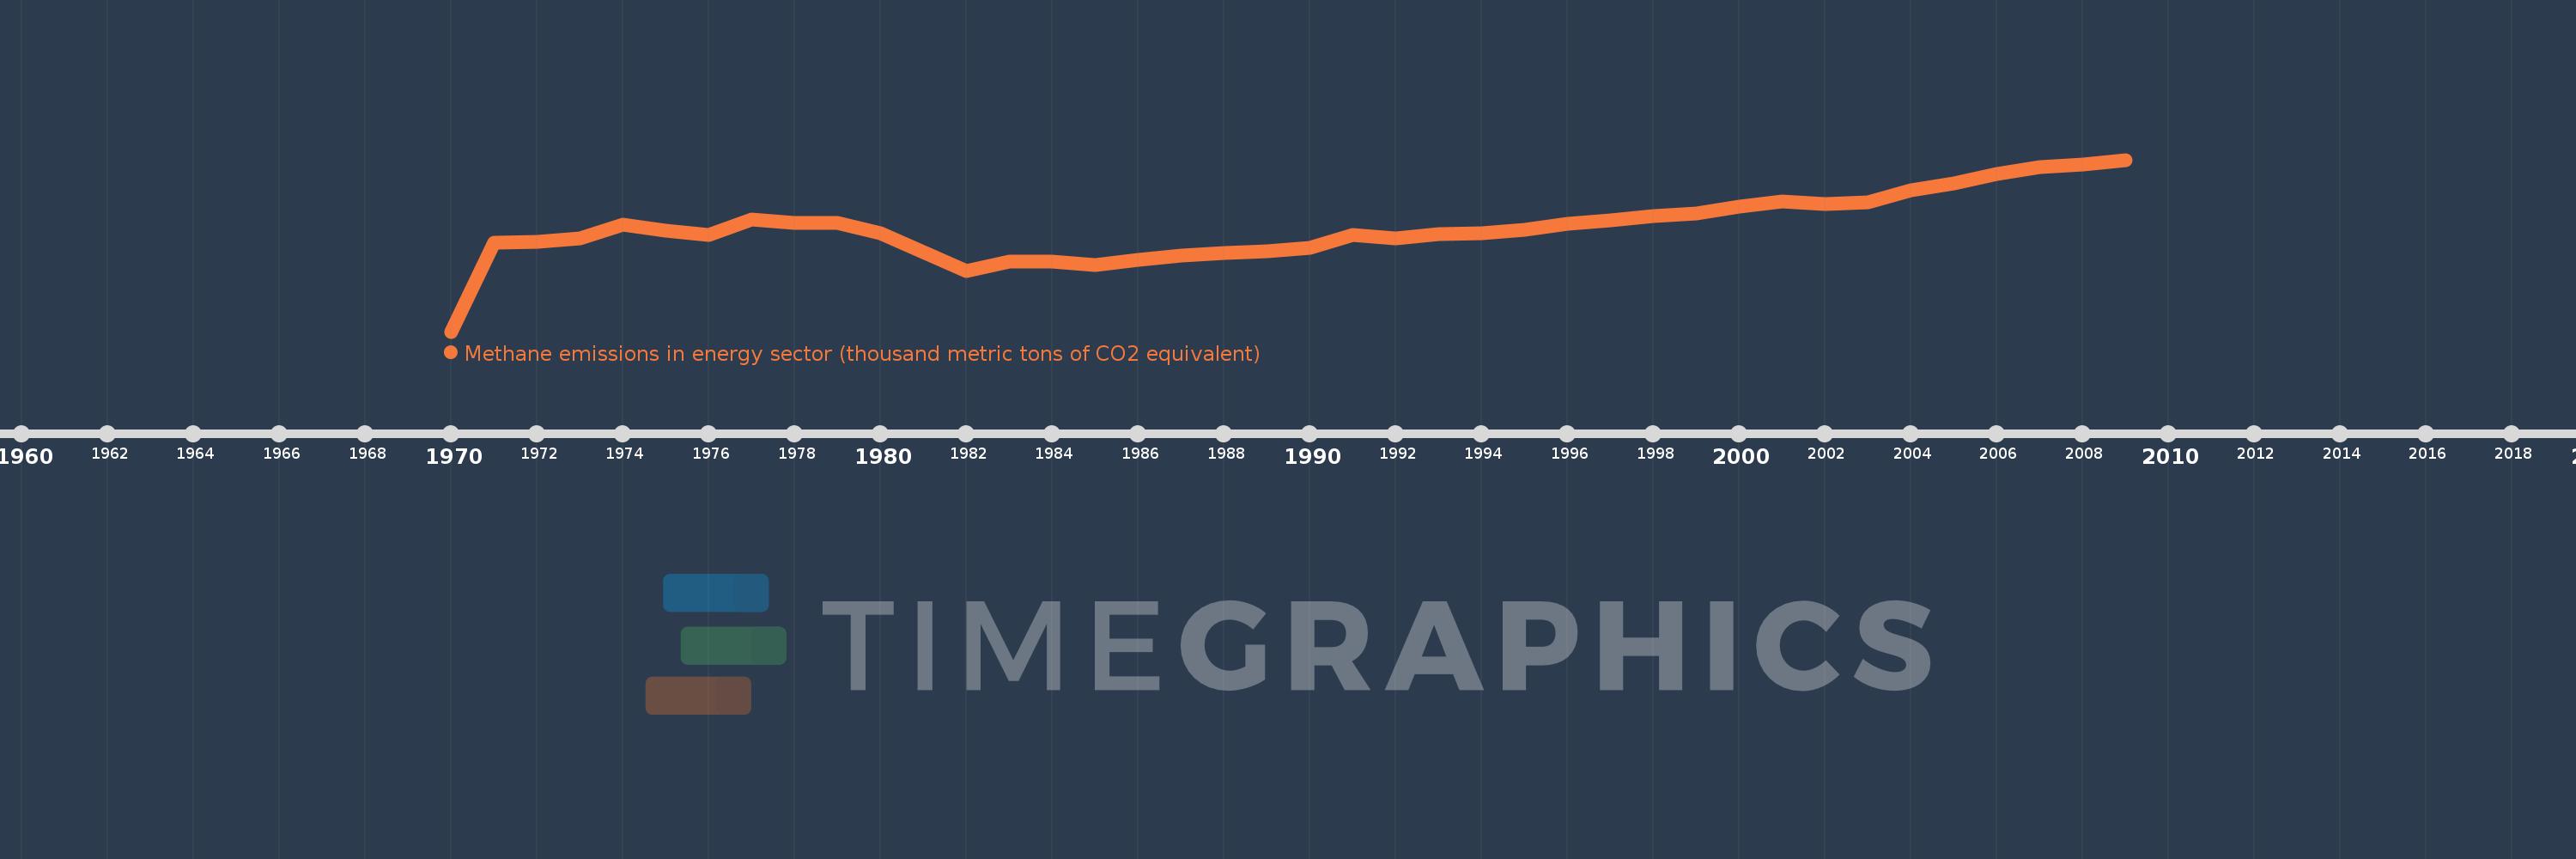
Methane emissions in energy sector (thousand metric tons of CO2 equivalent)
2009,2008,2007,2006,2005,2004,2003,2002,2001,2000,1999,1998,1997,1996,1995,1994,1993,1992,1991,1990,1989,1988,1987,1986,1985,1984,1983,1982,1981,1980,1979,1978,1977,1976,1975,1974,1973,1972,1971,1970
This statistics in other country:
AfghanistanAlbaniaAlgeriaAmerican SamoaAndorraAngolaAntigua and BarbudaArab WorldArgentinaArmeniaArubaAustraliaAustriaAzerbaijanBahamas, TheBahrainBangladeshBarbadosBelarusBelgiumBelizeBeninBermudaBhutanBoliviaBosnia and HerzegovinaBotswanaBrazilBritish Virgin IslandsBrunei DarussalamBulgariaBurkina FasoBurundiCabo VerdeCambodiaCameroonCanadaCaribbean small statesCayman IslandsCentral African RepublicCentral Europe and the BalticsChadChannel IslandsChileChinaColombiaComorosCongo, Dem. Rep.Congo, Rep.Costa RicaCote d'IvoireCroatiaCubaCuracaoCyprusCzech RepublicDenmarkDjiboutiDominicaDominican RepublicEarly-demographic dividendEast Asia & PacificEast Asia & Pacific (excluding high income)East Asia & Pacific (IDA & IBRD countries)EcuadorEgypt, Arab Rep.El SalvadorEquatorial GuineaEritreaEstoniaEthiopiaEuro areaEurope & Central AsiaEurope & Central Asia (excluding high income)Europe & Central Asia (IDA & IBRD countries)European UnionFaroe IslandsFijiFinlandFragile and conflict affected situationsFranceFrench PolynesiaGabonGambia, TheGeorgiaGermanyGhanaGibraltarGreeceGreenlandGrenadaGuamGuatemalaGuineaGuinea-BissauGuyanaHaitiHeavily indebted poor countries (HIPC)High incomeHondurasHong Kong SAR, ChinaHungaryIBRD onlyIcelandIDA & IBRD totalIDA blendIDA onlyIDA totalIndiaIndonesiaIran, Islamic Rep.IraqIrelandIsle of ManIsraelItalyJamaicaJapanJordanKazakhstanKenyaKiribatiKorea, Dem. People’s Rep.Korea, Rep.KosovoKuwaitKyrgyz RepublicLao PDRLate-demographic dividendLatin America & Caribbean Latin America & Caribbean (excluding high income)Latin America & the Caribbean (IDA & IBRD countries)LatviaLeast developed countries: UN classificationLebanonLesothoLiberiaLibyaLiechtensteinLithuaniaLow & middle incomeLow incomeLower middle incomeLuxembourgMacao SAR, ChinaMacedonia, FYRMadagascarMalawiMalaysiaMaldivesMaliMaltaMarshall IslandsMauritaniaMauritiusMexicoMicronesia, Fed. Sts.Middle East & North AfricaMiddle East & North Africa (excluding high income)Middle East & North Africa (IDA & IBRD countries)Middle incomeMoldovaMonacoMongoliaMontenegroMoroccoMozambiqueMyanmarNamibiaNauruNepalNetherlandsNew CaledoniaNew ZealandNicaraguaNigerNigeriaNorth AmericaNorthern Mariana IslandsNorwayOECD membersOmanOther small statesPacific island small statesPakistanPalauPanamaPapua New GuineaParaguayPeruPhilippinesPolandPortugalPost-demographic dividendPre-demographic dividendPuerto RicoQatarRomaniaRussian FederationRwandaSamoaSan MarinoSao Tome and PrincipeSaudi ArabiaSenegalSerbiaSeychellesSierra LeoneSingaporeSint Maarten (Dutch part)Slovak RepublicSloveniaSmall statesSolomon IslandsSomaliaSouth AfricaSouth AsiaSouth Asia (IDA & IBRD)South SudanSpainSri LankaSt. Kitts and NevisSt. LuciaSt. Martin (French part)St. Vincent and the GrenadinesSub-Saharan Africa Sub-Saharan Africa (excluding high income)Sub-Saharan Africa (IDA & IBRD countries)SudanSurinameSwazilandSwedenSwitzerlandSyrian Arab RepublicTajikistanTanzaniaThailandTimor-LesteTogoTongaTrinidad and TobagoTunisiaTurkeyTurkmenistanTurks and Caicos IslandsTuvaluUgandaUkraineUnited Arab EmiratesUnited KingdomUnited StatesUpper middle incomeUruguayUzbekistanVanuatuVenezuela, RBVietnamVirgin Islands (U.S.)West Bank and GazaWorldYemen, Rep.ZambiaZimbabwe Timeline:
This timeline shows a graph from 1970 to 2009 of Middle East & North Africa (IDA & IBRD countries). No data until 1969. Number of actual observations by date: 40.
Source name:
World Development Indicators
Source organization:
European Commission, Joint Research Centre (JRC)/Netherlands Environmental Assessment Agency (PBL). Emission Database for Global Atmospheric Research (EDGAR): http://edgar.jrc.ec.europa.eu/
Categories, topics:
Energy & Mining, Environment
Last updated:
apr 23, 2017
Indicators value changes by year
Maximum:
186.93K
jan 1, 2009
At the date of observation
Value
Absolute change
Change from previous value
jan 1, 1971
96.718K
+96.718K
%
jan 1, 1972
97.349K
+630.987
0.65%
jan 1, 1973
101.869K
+4.52K
4.64%
jan 1, 1974
116.278K
+14.409K
14.14%
jan 1, 1975
109.84K
-6.437K
-5.54%
jan 1, 1976
104.829K
-5.012K
-4.56%
jan 1, 1977
121.795K
+16.967K
16.19%
jan 1, 1978
118.495K
-3.3K
-2.71%
jan 1, 1979
117.997K
-497.873
-0.42%
jan 1, 1980
106.799K
-11.198K
-9.49%
jan 1, 1981
86.185K
-20.614K
-19.3%
jan 1, 1982
65.725K
-20.461K
-23.74%
jan 1, 1983
76.175K
+10.45K
15.9%
jan 1, 1984
76.438K
+263.315
0.35%
jan 1, 1985
72.5K
-3.938K
-5.15%
jan 1, 1986
78.454K
+5.954K
8.21%
jan 1, 1987
82.731K
+4.277K
5.45%
jan 1, 1988
85.975K
+3.244K
3.92%
jan 1, 1989
87.656K
+1.68K
1.95%
jan 1, 1990
91.103K
+3.447K
3.93%
jan 1, 1991
104.819K
+13.716K
15.06%
jan 1, 1992
101.756K
-3.063K
-2.92%
jan 1, 1993
105.792K
+4.036K
3.97%
jan 1, 1994
106.788K
+995.879
0.94%
jan 1, 1995
110.823K
+4.035K
3.78%
jan 1, 1996
116.887K
+6.064K
5.47%
jan 1, 1997
120.57K
+3.683K
3.15%
jan 1, 1998
125.797K
+5.226K
4.33%
jan 1, 1999
128.45K
+2.653K
2.11%
jan 1, 2000
135.617K
+7.168K
5.58%
jan 1, 2001
142.064K
+6.447K
4.75%
jan 1, 2002
138.732K
-3.332K
-2.35%
jan 1, 2003
140.427K
+1.694K
1.22%
jan 1, 2004
153.49K
+13.063K
9.3%
jan 1, 2005
160.889K
+7.4K
4.82%
jan 1, 2006
171.193K
+10.304K
6.4%
jan 1, 2007
179.222K
+8.029K
4.69%
jan 1, 2008
181.914K
+2.692K
1.5%
jan 1, 2009
186.93K
+5.016K
2.76%
Ranking of countries by current statistics by years


Comments: