29
/
en
AIzaSyAYiBZKx7MnpbEhh9jyipgxe19OcubqV5w
April 1, 2024
160752
Israel
ISR
true
2
1
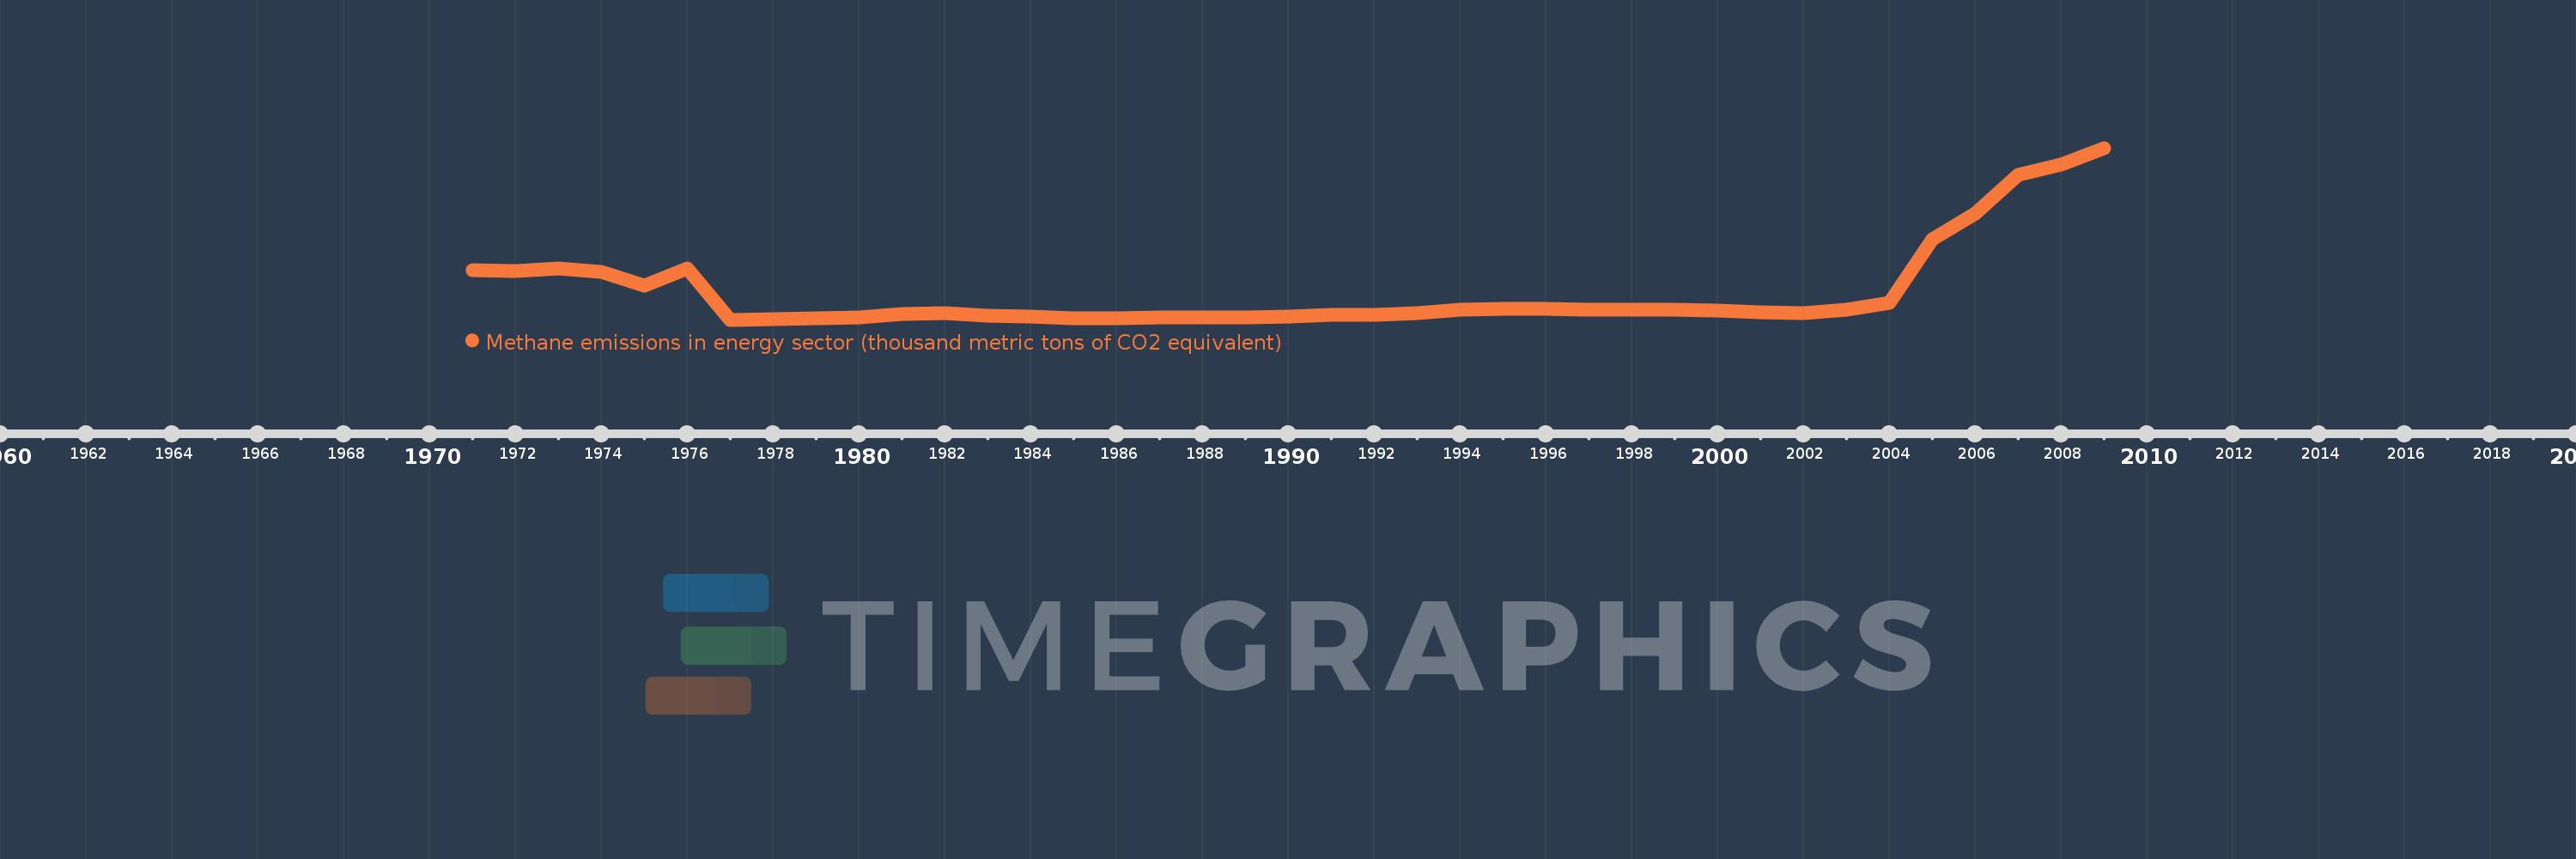
Methane emissions in energy sector (thousand metric tons of CO2 equivalent)
2009,2008,2007,2006,2005,2004,2003,2002,2001,2000,1999,1998,1997,1996,1995,1994,1993,1992,1991,1990,1989,1988,1987,1986,1985,1984,1983,1982,1981,1980,1979,1978,1977,1976,1975,1974,1973,1972,1971
This statistics in other country:
AfghanistanAlbaniaAlgeriaAmerican SamoaAndorraAngolaAntigua and BarbudaArab WorldArgentinaArmeniaArubaAustraliaAustriaAzerbaijanBahamas, TheBahrainBangladeshBarbadosBelarusBelgiumBelizeBeninBermudaBhutanBoliviaBosnia and HerzegovinaBotswanaBrazilBritish Virgin IslandsBrunei DarussalamBulgariaBurkina FasoBurundiCabo VerdeCambodiaCameroonCanadaCaribbean small statesCayman IslandsCentral African RepublicCentral Europe and the BalticsChadChannel IslandsChileChinaColombiaComorosCongo, Dem. Rep.Congo, Rep.Costa RicaCote d'IvoireCroatiaCubaCuracaoCyprusCzech RepublicDenmarkDjiboutiDominicaDominican RepublicEarly-demographic dividendEast Asia & PacificEast Asia & Pacific (excluding high income)East Asia & Pacific (IDA & IBRD countries)EcuadorEgypt, Arab Rep.El SalvadorEquatorial GuineaEritreaEstoniaEthiopiaEuro areaEurope & Central AsiaEurope & Central Asia (excluding high income)Europe & Central Asia (IDA & IBRD countries)European UnionFaroe IslandsFijiFinlandFragile and conflict affected situationsFranceFrench PolynesiaGabonGambia, TheGeorgiaGermanyGhanaGibraltarGreeceGreenlandGrenadaGuamGuatemalaGuineaGuinea-BissauGuyanaHaitiHeavily indebted poor countries (HIPC)High incomeHondurasHong Kong SAR, ChinaHungaryIBRD onlyIcelandIDA & IBRD totalIDA blendIDA onlyIDA totalIndiaIndonesiaIran, Islamic Rep.IraqIrelandIsle of ManIsraelItalyJamaicaJapanJordanKazakhstanKenyaKiribatiKorea, Dem. People’s Rep.Korea, Rep.KosovoKuwaitKyrgyz RepublicLao PDRLate-demographic dividendLatin America & Caribbean Latin America & Caribbean (excluding high income)Latin America & the Caribbean (IDA & IBRD countries)LatviaLeast developed countries: UN classificationLebanonLesothoLiberiaLibyaLiechtensteinLithuaniaLow & middle incomeLow incomeLower middle incomeLuxembourgMacao SAR, ChinaMacedonia, FYRMadagascarMalawiMalaysiaMaldivesMaliMaltaMarshall IslandsMauritaniaMauritiusMexicoMicronesia, Fed. Sts.Middle East & North AfricaMiddle East & North Africa (excluding high income)Middle East & North Africa (IDA & IBRD countries)Middle incomeMoldovaMonacoMongoliaMontenegroMoroccoMozambiqueMyanmarNamibiaNauruNepalNetherlandsNew CaledoniaNew ZealandNicaraguaNigerNigeriaNorth AmericaNorthern Mariana IslandsNorwayOECD membersOmanOther small statesPacific island small statesPakistanPalauPanamaPapua New GuineaParaguayPeruPhilippinesPolandPortugalPost-demographic dividendPre-demographic dividendPuerto RicoQatarRomaniaRussian FederationRwandaSamoaSan MarinoSao Tome and PrincipeSaudi ArabiaSenegalSerbiaSeychellesSierra LeoneSingaporeSint Maarten (Dutch part)Slovak RepublicSloveniaSmall statesSolomon IslandsSomaliaSouth AfricaSouth AsiaSouth Asia (IDA & IBRD)South SudanSpainSri LankaSt. Kitts and NevisSt. LuciaSt. Martin (French part)St. Vincent and the GrenadinesSub-Saharan Africa Sub-Saharan Africa (excluding high income)Sub-Saharan Africa (IDA & IBRD countries)SudanSurinameSwazilandSwedenSwitzerlandSyrian Arab RepublicTajikistanTanzaniaThailandTimor-LesteTogoTongaTrinidad and TobagoTunisiaTurkeyTurkmenistanTurks and Caicos IslandsTuvaluUgandaUkraineUnited Arab EmiratesUnited KingdomUnited StatesUpper middle incomeUruguayUzbekistanVanuatuVenezuela, RBVietnamVirgin Islands (U.S.)West Bank and GazaWorldYemen, Rep.ZambiaZimbabwe Timeline:
This timeline shows a graph from 1971 to 2009 of Israel. No data until 1970. Number of actual observations by date: 39.
Source name:
World Development Indicators
Source organization:
European Commission, Joint Research Centre (JRC)/Netherlands Environmental Assessment Agency (PBL). Emission Database for Global Atmospheric Research (EDGAR): http://edgar.jrc.ec.europa.eu/
Categories, topics:
Energy & Mining, Environment
Last updated:
apr 23, 2017
Indicators value changes by year
Minimum:
91.254
jan 1, 1977
Maximum:
1.034K
jan 1, 2009
At the date of observation
Value
Absolute change
Change from previous value
jan 1, 1971
361.36
+361.36
0.0%
jan 1, 1972
360.602
-0.758
-0.21%
jan 1, 1973
370.705
+10.103
2.8%
jan 1, 1974
354.98
-15.725
-4.24%
jan 1, 1975
276.167
-78.814
-22.2%
jan 1, 1976
374.186
+98.019
35.49%
jan 1, 1977
91.254
-282.932
-75.61%
jan 1, 1978
92.313
+1.059
1.16%
jan 1, 1979
100.158
+7.846
8.5%
jan 1, 1980
103.278
+3.119
3.11%
jan 1, 1981
122.251
+18.973
18.37%
jan 1, 1982
125.591
+3.34
2.73%
jan 1, 1983
111.208
-14.383
-11.45%
jan 1, 1984
107.161
-4.047
-3.64%
jan 1, 1985
101.187
-5.974
-5.58%
jan 1, 1986
99.676
-1.51
-1.49%
jan 1, 1987
105.13
+5.454
5.47%
jan 1, 1988
105.098
-0.032
-0.03%
jan 1, 1989
104.863
-0.235
-0.22%
jan 1, 1990
107.238
+2.375
2.27%
jan 1, 1991
118.109
+10.87
10.14%
jan 1, 1992
116.072
-2.036
-1.72%
jan 1, 1993
129.737
+13.665
11.77%
jan 1, 1994
147.345
+17.607
13.57%
jan 1, 1995
151.298
+3.953
2.68%
jan 1, 1996
152.505
+1.208
0.8%
jan 1, 1997
145.562
-6.943
-4.55%
jan 1, 1998
147.158
+1.596
1.1%
jan 1, 1999
145.313
-1.845
-1.25%
jan 1, 2000
140.685
-4.628
-3.19%
jan 1, 2001
132.478
-8.207
-5.83%
jan 1, 2002
126.562
-5.917
-4.47%
jan 1, 2003
148.49
+21.929
17.33%
jan 1, 2004
185.343
+36.852
24.82%
jan 1, 2005
533.478
+348.135
187.83%
jan 1, 2006
675.292
+141.813
26.58%
jan 1, 2007
884.95
+209.658
31.05%
jan 1, 2008
943.403
+58.452
6.61%
jan 1, 2009
1.034K
+90.953
9.64%
Ranking of countries by current statistics by years


Comments: