29
/
en
AIzaSyAYiBZKx7MnpbEhh9jyipgxe19OcubqV5w
April 1, 2024
259877
Tajikistan
TJK
true
2
1
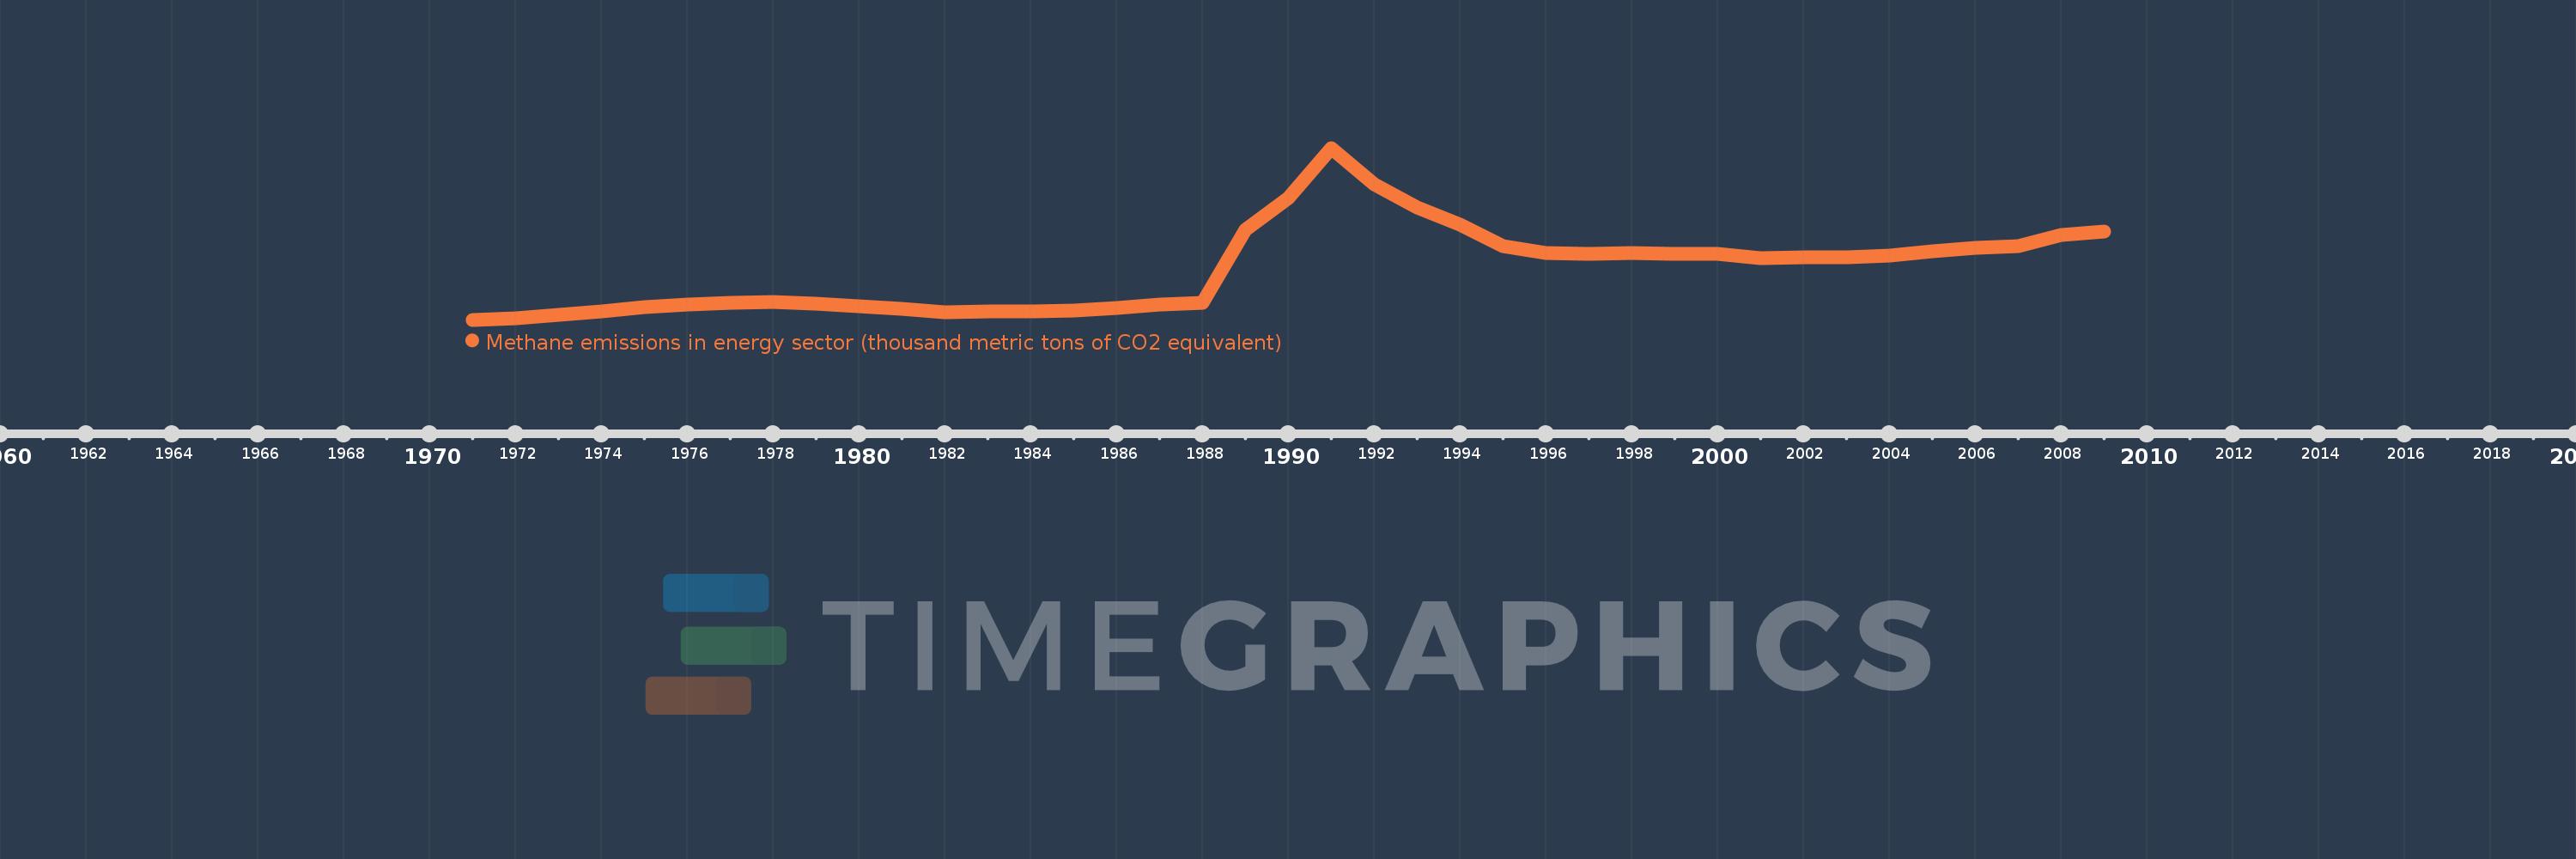
Methane emissions in energy sector (thousand metric tons of CO2 equivalent)
2009,2008,2007,2006,2005,2004,2003,2002,2001,2000,1999,1998,1997,1996,1995,1994,1993,1992,1991,1990,1989,1988,1987,1986,1985,1984,1983,1982,1981,1980,1979,1978,1977,1976,1975,1974,1973,1972,1971
This statistics in other country:
AfghanistanAlbaniaAlgeriaAmerican SamoaAndorraAngolaAntigua and BarbudaArab WorldArgentinaArmeniaArubaAustraliaAustriaAzerbaijanBahamas, TheBahrainBangladeshBarbadosBelarusBelgiumBelizeBeninBermudaBhutanBoliviaBosnia and HerzegovinaBotswanaBrazilBritish Virgin IslandsBrunei DarussalamBulgariaBurkina FasoBurundiCabo VerdeCambodiaCameroonCanadaCaribbean small statesCayman IslandsCentral African RepublicCentral Europe and the BalticsChadChannel IslandsChileChinaColombiaComorosCongo, Dem. Rep.Congo, Rep.Costa RicaCote d'IvoireCroatiaCubaCuracaoCyprusCzech RepublicDenmarkDjiboutiDominicaDominican RepublicEarly-demographic dividendEast Asia & PacificEast Asia & Pacific (excluding high income)East Asia & Pacific (IDA & IBRD countries)EcuadorEgypt, Arab Rep.El SalvadorEquatorial GuineaEritreaEstoniaEthiopiaEuro areaEurope & Central AsiaEurope & Central Asia (excluding high income)Europe & Central Asia (IDA & IBRD countries)European UnionFaroe IslandsFijiFinlandFragile and conflict affected situationsFranceFrench PolynesiaGabonGambia, TheGeorgiaGermanyGhanaGibraltarGreeceGreenlandGrenadaGuamGuatemalaGuineaGuinea-BissauGuyanaHaitiHeavily indebted poor countries (HIPC)High incomeHondurasHong Kong SAR, ChinaHungaryIBRD onlyIcelandIDA & IBRD totalIDA blendIDA onlyIDA totalIndiaIndonesiaIran, Islamic Rep.IraqIrelandIsle of ManIsraelItalyJamaicaJapanJordanKazakhstanKenyaKiribatiKorea, Dem. People’s Rep.Korea, Rep.KosovoKuwaitKyrgyz RepublicLao PDRLate-demographic dividendLatin America & Caribbean Latin America & Caribbean (excluding high income)Latin America & the Caribbean (IDA & IBRD countries)LatviaLeast developed countries: UN classificationLebanonLesothoLiberiaLibyaLiechtensteinLithuaniaLow & middle incomeLow incomeLower middle incomeLuxembourgMacao SAR, ChinaMacedonia, FYRMadagascarMalawiMalaysiaMaldivesMaliMaltaMarshall IslandsMauritaniaMauritiusMexicoMicronesia, Fed. Sts.Middle East & North AfricaMiddle East & North Africa (excluding high income)Middle East & North Africa (IDA & IBRD countries)Middle incomeMoldovaMonacoMongoliaMontenegroMoroccoMozambiqueMyanmarNamibiaNauruNepalNetherlandsNew CaledoniaNew ZealandNicaraguaNigerNigeriaNorth AmericaNorthern Mariana IslandsNorwayOECD membersOmanOther small statesPacific island small statesPakistanPalauPanamaPapua New GuineaParaguayPeruPhilippinesPolandPortugalPost-demographic dividendPre-demographic dividendPuerto RicoQatarRomaniaRussian FederationRwandaSamoaSan MarinoSao Tome and PrincipeSaudi ArabiaSenegalSerbiaSeychellesSierra LeoneSingaporeSint Maarten (Dutch part)Slovak RepublicSloveniaSmall statesSolomon IslandsSomaliaSouth AfricaSouth AsiaSouth Asia (IDA & IBRD)South SudanSpainSri LankaSt. Kitts and NevisSt. LuciaSt. Martin (French part)St. Vincent and the GrenadinesSub-Saharan Africa Sub-Saharan Africa (excluding high income)Sub-Saharan Africa (IDA & IBRD countries)SudanSurinameSwazilandSwedenSwitzerlandSyrian Arab RepublicTajikistanTanzaniaThailandTimor-LesteTogoTongaTrinidad and TobagoTunisiaTurkeyTurkmenistanTurks and Caicos IslandsTuvaluUgandaUkraineUnited Arab EmiratesUnited KingdomUnited StatesUpper middle incomeUruguayUzbekistanVanuatuVenezuela, RBVietnamVirgin Islands (U.S.)West Bank and GazaWorldYemen, Rep.ZambiaZimbabwe Timeline:
This timeline shows a graph from 1971 to 2009 of Tajikistan. No data until 1970. Number of actual observations by date: 39.
Source name:
World Development Indicators
Source organization:
European Commission, Joint Research Centre (JRC)/Netherlands Environmental Assessment Agency (PBL). Emission Database for Global Atmospheric Research (EDGAR): http://edgar.jrc.ec.europa.eu/
Categories, topics:
Energy & Mining, Environment
Last updated:
apr 23, 2017
Indicators value changes by year
Minimum:
263.832
jan 1, 1971
Maximum:
790.652
jan 1, 1991
At the date of observation
Value
Absolute change
Change from previous value
jan 1, 1971
263.832
+263.832
0.0%
jan 1, 1972
267.597
+3.764
1.43%
jan 1, 1973
278.107
+10.51
3.93%
jan 1, 1974
289.68
+11.573
4.16%
jan 1, 1975
302.617
+12.938
4.47%
jan 1, 1976
309.987
+7.37
2.44%
jan 1, 1977
316.712
+6.725
2.17%
jan 1, 1978
318.127
+1.415
0.45%
jan 1, 1979
313.549
-4.578
-1.44%
jan 1, 1980
306.332
-7.217
-2.3%
jan 1, 1981
298.043
-8.289
-2.71%
jan 1, 1982
287.992
-10.051
-3.37%
jan 1, 1983
290.176
+2.184
0.76%
jan 1, 1984
290.55
+0.374
0.13%
jan 1, 1985
292.868
+2.318
0.8%
jan 1, 1986
299.076
+6.208
2.12%
jan 1, 1987
311.14
+12.064
4.03%
jan 1, 1988
314.581
+3.441
1.11%
jan 1, 1989
539.131
+224.55
71.38%
jan 1, 1990
638.388
+99.257
18.41%
jan 1, 1991
790.652
+152.264
23.85%
jan 1, 1992
679.035
-111.617
-14.12%
jan 1, 1993
608.179
-70.856
-10.43%
jan 1, 1994
554.978
-53.201
-8.75%
jan 1, 1995
488.548
-66.429
-11.97%
jan 1, 1996
469.803
-18.745
-3.84%
jan 1, 1997
466.651
-3.152
-0.67%
jan 1, 1998
467.597
+0.946
0.2%
jan 1, 1999
465.196
-2.4
-0.51%
jan 1, 2000
464.908
-0.288
-0.06%
jan 1, 2001
453.351
-11.558
-2.49%
jan 1, 2002
454.925
+1.575
0.35%
jan 1, 2003
456.201
+1.276
0.28%
jan 1, 2004
461.589
+5.388
1.18%
jan 1, 2005
473.864
+12.275
2.66%
jan 1, 2006
485.101
+11.237
2.37%
jan 1, 2007
488.726
+3.626
0.75%
jan 1, 2008
524.358
+35.632
7.29%
jan 1, 2009
534.135
+9.777
1.86%
Ranking of countries by current statistics by years


Comments: