29
/
en
AIzaSyAYiBZKx7MnpbEhh9jyipgxe19OcubqV5w
April 1, 2024
91454
Brazil
BRA
true
2
1
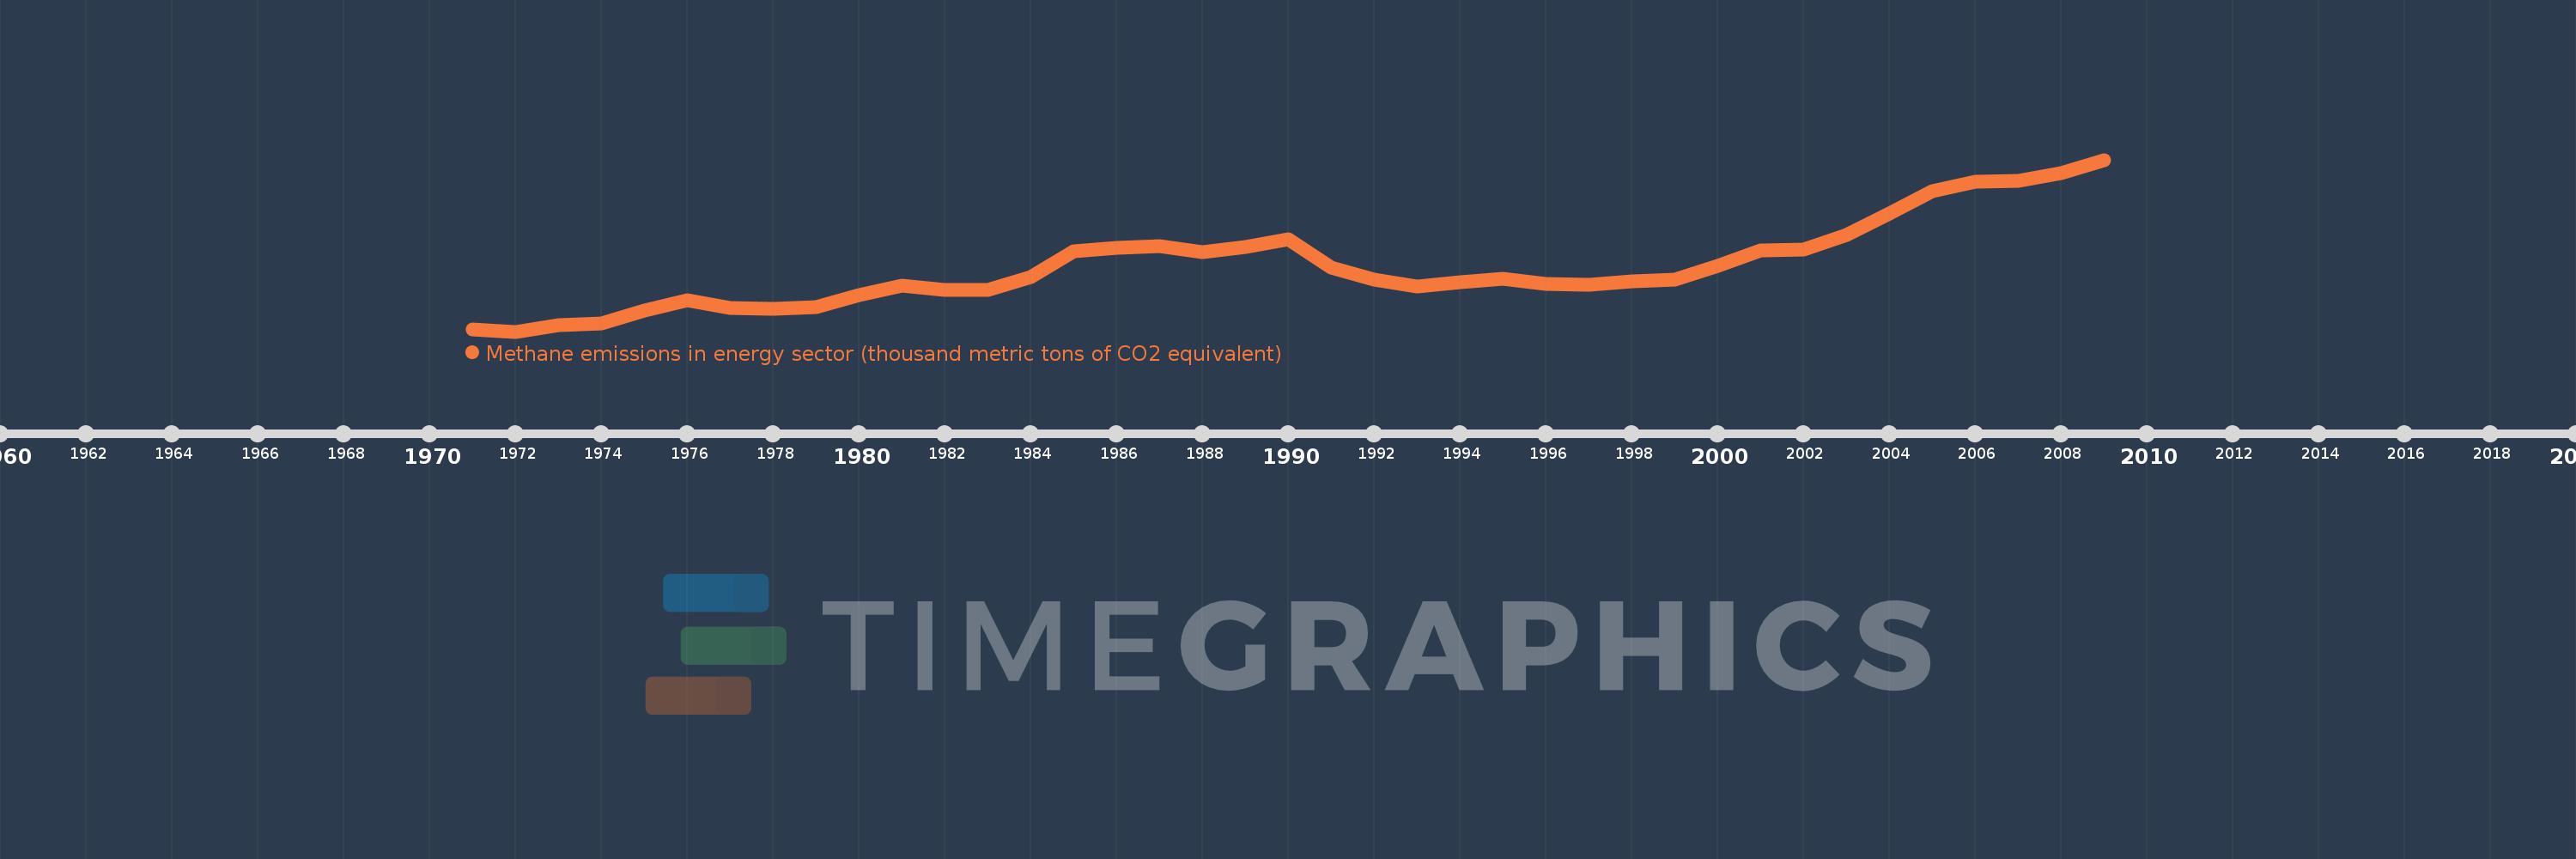
Methane emissions in energy sector (thousand metric tons of CO2 equivalent)
2009,2008,2007,2006,2005,2004,2003,2002,2001,2000,1999,1998,1997,1996,1995,1994,1993,1992,1991,1990,1989,1988,1987,1986,1985,1984,1983,1982,1981,1980,1979,1978,1977,1976,1975,1974,1973,1972,1971
This statistics in other country:
AfghanistanAlbaniaAlgeriaAmerican SamoaAndorraAngolaAntigua and BarbudaArab WorldArgentinaArmeniaArubaAustraliaAustriaAzerbaijanBahamas, TheBahrainBangladeshBarbadosBelarusBelgiumBelizeBeninBermudaBhutanBoliviaBosnia and HerzegovinaBotswanaBrazilBritish Virgin IslandsBrunei DarussalamBulgariaBurkina FasoBurundiCabo VerdeCambodiaCameroonCanadaCaribbean small statesCayman IslandsCentral African RepublicCentral Europe and the BalticsChadChannel IslandsChileChinaColombiaComorosCongo, Dem. Rep.Congo, Rep.Costa RicaCote d'IvoireCroatiaCubaCuracaoCyprusCzech RepublicDenmarkDjiboutiDominicaDominican RepublicEarly-demographic dividendEast Asia & PacificEast Asia & Pacific (excluding high income)East Asia & Pacific (IDA & IBRD countries)EcuadorEgypt, Arab Rep.El SalvadorEquatorial GuineaEritreaEstoniaEthiopiaEuro areaEurope & Central AsiaEurope & Central Asia (excluding high income)Europe & Central Asia (IDA & IBRD countries)European UnionFaroe IslandsFijiFinlandFragile and conflict affected situationsFranceFrench PolynesiaGabonGambia, TheGeorgiaGermanyGhanaGibraltarGreeceGreenlandGrenadaGuamGuatemalaGuineaGuinea-BissauGuyanaHaitiHeavily indebted poor countries (HIPC)High incomeHondurasHong Kong SAR, ChinaHungaryIBRD onlyIcelandIDA & IBRD totalIDA blendIDA onlyIDA totalIndiaIndonesiaIran, Islamic Rep.IraqIrelandIsle of ManIsraelItalyJamaicaJapanJordanKazakhstanKenyaKiribatiKorea, Dem. People’s Rep.Korea, Rep.KosovoKuwaitKyrgyz RepublicLao PDRLate-demographic dividendLatin America & Caribbean Latin America & Caribbean (excluding high income)Latin America & the Caribbean (IDA & IBRD countries)LatviaLeast developed countries: UN classificationLebanonLesothoLiberiaLibyaLiechtensteinLithuaniaLow & middle incomeLow incomeLower middle incomeLuxembourgMacao SAR, ChinaMacedonia, FYRMadagascarMalawiMalaysiaMaldivesMaliMaltaMarshall IslandsMauritaniaMauritiusMexicoMicronesia, Fed. Sts.Middle East & North AfricaMiddle East & North Africa (excluding high income)Middle East & North Africa (IDA & IBRD countries)Middle incomeMoldovaMonacoMongoliaMontenegroMoroccoMozambiqueMyanmarNamibiaNauruNepalNetherlandsNew CaledoniaNew ZealandNicaraguaNigerNigeriaNorth AmericaNorthern Mariana IslandsNorwayOECD membersOmanOther small statesPacific island small statesPakistanPalauPanamaPapua New GuineaParaguayPeruPhilippinesPolandPortugalPost-demographic dividendPre-demographic dividendPuerto RicoQatarRomaniaRussian FederationRwandaSamoaSan MarinoSao Tome and PrincipeSaudi ArabiaSenegalSerbiaSeychellesSierra LeoneSingaporeSint Maarten (Dutch part)Slovak RepublicSloveniaSmall statesSolomon IslandsSomaliaSouth AfricaSouth AsiaSouth Asia (IDA & IBRD)South SudanSpainSri LankaSt. Kitts and NevisSt. LuciaSt. Martin (French part)St. Vincent and the GrenadinesSub-Saharan Africa Sub-Saharan Africa (excluding high income)Sub-Saharan Africa (IDA & IBRD countries)SudanSurinameSwazilandSwedenSwitzerlandSyrian Arab RepublicTajikistanTanzaniaThailandTimor-LesteTogoTongaTrinidad and TobagoTunisiaTurkeyTurkmenistanTurks and Caicos IslandsTuvaluUgandaUkraineUnited Arab EmiratesUnited KingdomUnited StatesUpper middle incomeUruguayUzbekistanVanuatuVenezuela, RBVietnamVirgin Islands (U.S.)West Bank and GazaWorldYemen, Rep.ZambiaZimbabwe Timeline:
This timeline shows a graph from 1971 to 2009 of Brazil. No data until 1970. Number of actual observations by date: 39.
Source name:
World Development Indicators
Source organization:
European Commission, Joint Research Centre (JRC)/Netherlands Environmental Assessment Agency (PBL). Emission Database for Global Atmospheric Research (EDGAR): http://edgar.jrc.ec.europa.eu/
Categories, topics:
Energy & Mining, Environment
Last updated:
apr 23, 2017
Indicators value changes by year
Minimum:
15.426K
jan 1, 1972
Maximum:
41.388K
jan 1, 2009
At the date of observation
Value
Absolute change
Change from previous value
jan 1, 1971
15.707K
+15.707K
0.0%
jan 1, 1972
15.426K
-280.782
-1.79%
jan 1, 1973
16.388K
+961.91
6.24%
jan 1, 1974
16.614K
+225.145
1.37%
jan 1, 1975
18.588K
+1.974K
11.88%
jan 1, 1976
20.205K
+1.617K
8.7%
jan 1, 1977
18.942K
-1.263K
-6.25%
jan 1, 1978
18.81K
-132.013
-0.7%
jan 1, 1979
19.15K
+339.596
1.81%
jan 1, 1980
20.934K
+1.784K
9.32%
jan 1, 1981
22.403K
+1.469K
7.02%
jan 1, 1982
21.69K
-713.01
-3.18%
jan 1, 1983
21.727K
+37.202
0.17%
jan 1, 1984
23.611K
+1.884K
8.67%
jan 1, 1985
27.557K
+3.946K
16.71%
jan 1, 1986
28.121K
+564.068
2.05%
jan 1, 1987
28.343K
+222.491
0.79%
jan 1, 1988
27.405K
-938.509
-3.31%
jan 1, 1989
28.249K
+843.521
3.08%
jan 1, 1990
29.434K
+1.185K
4.2%
jan 1, 1991
25.043K
-4.39K
-14.92%
jan 1, 1992
23.301K
-1.742K
-6.96%
jan 1, 1993
22.213K
-1.088K
-4.67%
jan 1, 1994
22.877K
+663.813
2.99%
jan 1, 1995
23.445K
+568.435
2.48%
jan 1, 1996
22.665K
-779.964
-3.33%
jan 1, 1997
22.526K
-139.457
-0.62%
jan 1, 1998
23.066K
+540.578
2.4%
jan 1, 1999
23.236K
+169.885
0.74%
jan 1, 2000
25.354K
+2.118K
9.11%
jan 1, 2001
27.756K
+2.402K
9.47%
jan 1, 2002
27.83K
+73.921
0.27%
jan 1, 2003
30.037K
+2.208K
7.93%
jan 1, 2004
33.337K
+3.3K
10.99%
jan 1, 2005
36.586K
+3.249K
9.75%
jan 1, 2006
38.051K
+1.465K
4.0%
jan 1, 2007
38.15K
+99.278
0.26%
jan 1, 2008
39.317K
+1.167K
3.06%
jan 1, 2009
41.388K
+2.071K
5.27%
Ranking of countries by current statistics by years


Comments: