29
/
en
AIzaSyAYiBZKx7MnpbEhh9jyipgxe19OcubqV5w
April 1, 2024
250085
St. Kitts and Nevis
KNA
true
2
1
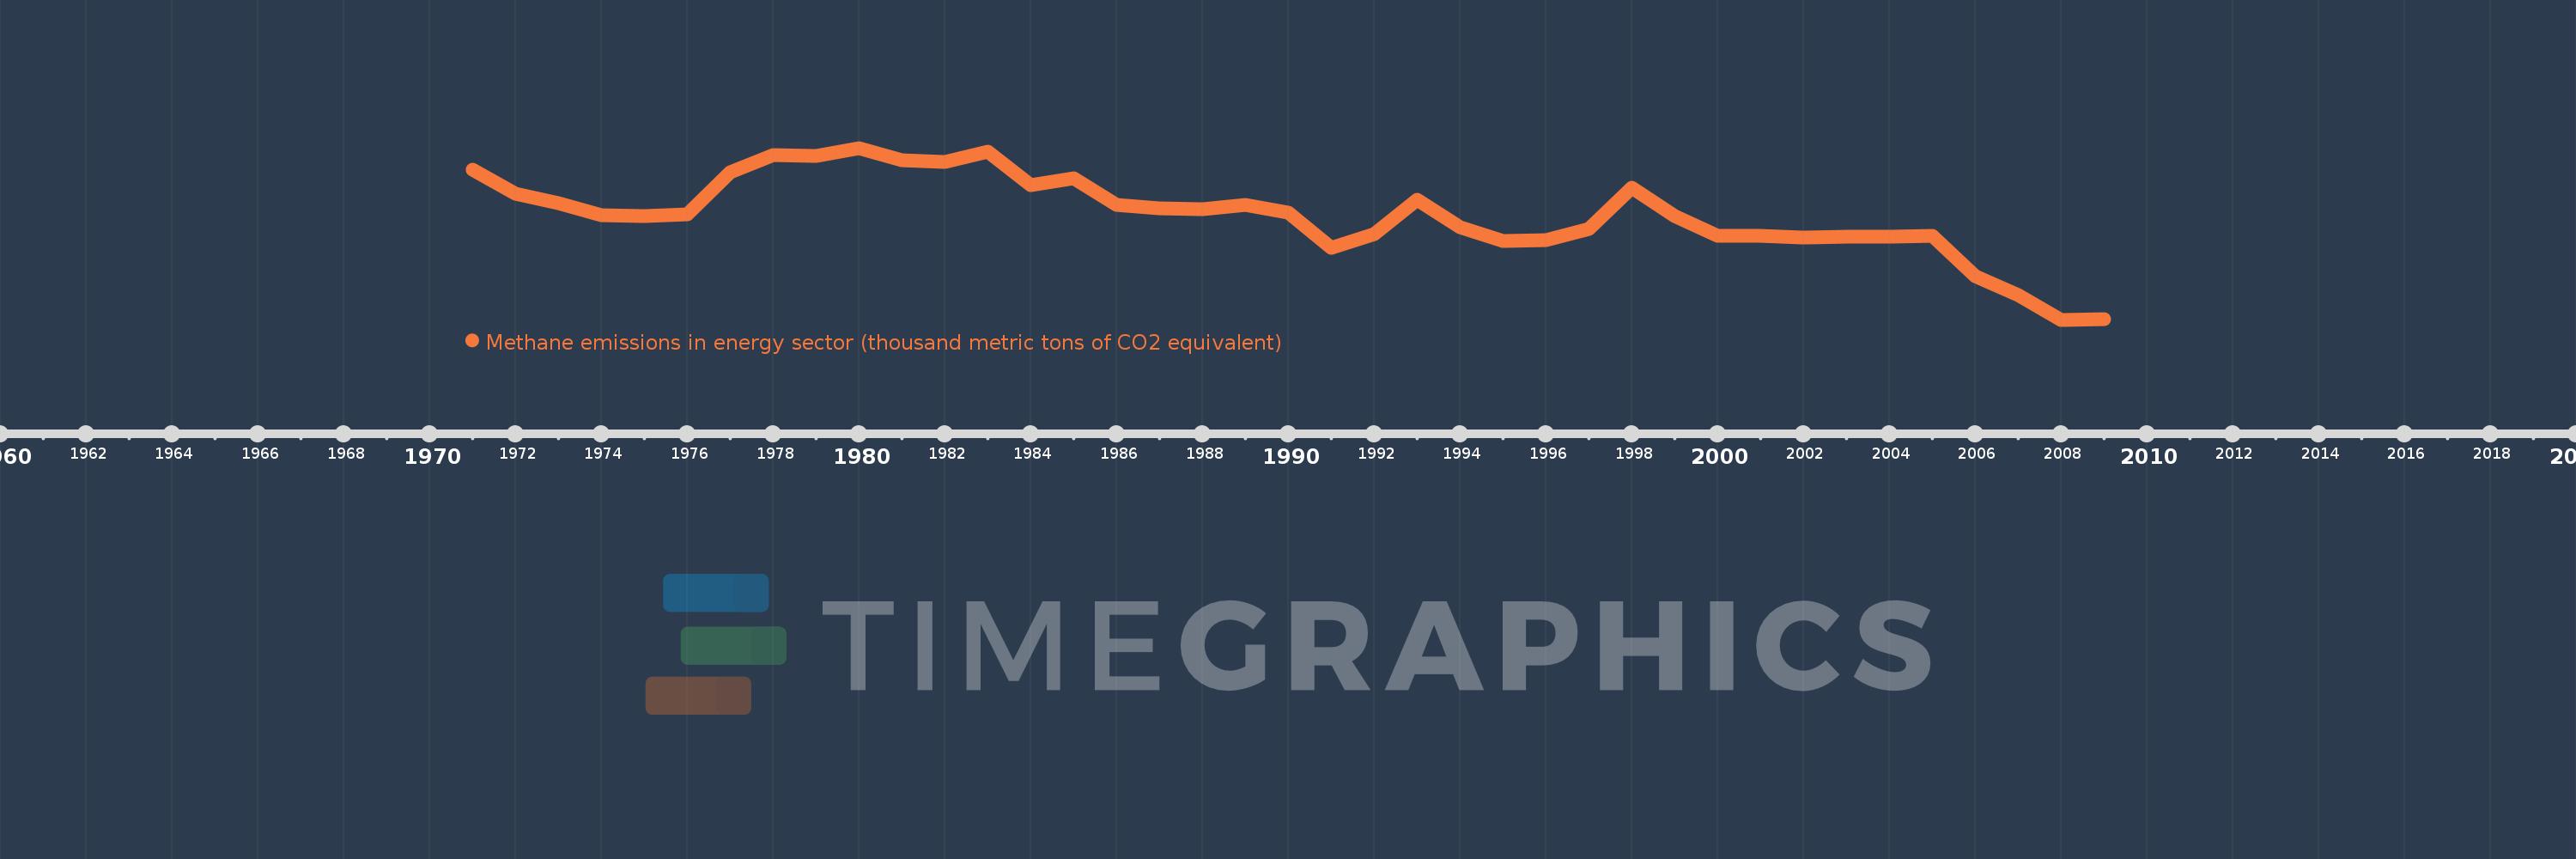
Methane emissions in energy sector (thousand metric tons of CO2 equivalent)
2009,2008,2007,2006,2005,2004,2003,2002,2001,2000,1999,1998,1997,1996,1995,1994,1993,1992,1991,1990,1989,1988,1987,1986,1985,1984,1983,1982,1981,1980,1979,1978,1977,1976,1975,1974,1973,1972,1971
This statistics in other country:
AfghanistanAlbaniaAlgeriaAmerican SamoaAndorraAngolaAntigua and BarbudaArab WorldArgentinaArmeniaArubaAustraliaAustriaAzerbaijanBahamas, TheBahrainBangladeshBarbadosBelarusBelgiumBelizeBeninBermudaBhutanBoliviaBosnia and HerzegovinaBotswanaBrazilBritish Virgin IslandsBrunei DarussalamBulgariaBurkina FasoBurundiCabo VerdeCambodiaCameroonCanadaCaribbean small statesCayman IslandsCentral African RepublicCentral Europe and the BalticsChadChannel IslandsChileChinaColombiaComorosCongo, Dem. Rep.Congo, Rep.Costa RicaCote d'IvoireCroatiaCubaCuracaoCyprusCzech RepublicDenmarkDjiboutiDominicaDominican RepublicEarly-demographic dividendEast Asia & PacificEast Asia & Pacific (excluding high income)East Asia & Pacific (IDA & IBRD countries)EcuadorEgypt, Arab Rep.El SalvadorEquatorial GuineaEritreaEstoniaEthiopiaEuro areaEurope & Central AsiaEurope & Central Asia (excluding high income)Europe & Central Asia (IDA & IBRD countries)European UnionFaroe IslandsFijiFinlandFragile and conflict affected situationsFranceFrench PolynesiaGabonGambia, TheGeorgiaGermanyGhanaGibraltarGreeceGreenlandGrenadaGuamGuatemalaGuineaGuinea-BissauGuyanaHaitiHeavily indebted poor countries (HIPC)High incomeHondurasHong Kong SAR, ChinaHungaryIBRD onlyIcelandIDA & IBRD totalIDA blendIDA onlyIDA totalIndiaIndonesiaIran, Islamic Rep.IraqIrelandIsle of ManIsraelItalyJamaicaJapanJordanKazakhstanKenyaKiribatiKorea, Dem. People’s Rep.Korea, Rep.KosovoKuwaitKyrgyz RepublicLao PDRLate-demographic dividendLatin America & Caribbean Latin America & Caribbean (excluding high income)Latin America & the Caribbean (IDA & IBRD countries)LatviaLeast developed countries: UN classificationLebanonLesothoLiberiaLibyaLiechtensteinLithuaniaLow & middle incomeLow incomeLower middle incomeLuxembourgMacao SAR, ChinaMacedonia, FYRMadagascarMalawiMalaysiaMaldivesMaliMaltaMarshall IslandsMauritaniaMauritiusMexicoMicronesia, Fed. Sts.Middle East & North AfricaMiddle East & North Africa (excluding high income)Middle East & North Africa (IDA & IBRD countries)Middle incomeMoldovaMonacoMongoliaMontenegroMoroccoMozambiqueMyanmarNamibiaNauruNepalNetherlandsNew CaledoniaNew ZealandNicaraguaNigerNigeriaNorth AmericaNorthern Mariana IslandsNorwayOECD membersOmanOther small statesPacific island small statesPakistanPalauPanamaPapua New GuineaParaguayPeruPhilippinesPolandPortugalPost-demographic dividendPre-demographic dividendPuerto RicoQatarRomaniaRussian FederationRwandaSamoaSan MarinoSao Tome and PrincipeSaudi ArabiaSenegalSerbiaSeychellesSierra LeoneSingaporeSint Maarten (Dutch part)Slovak RepublicSloveniaSmall statesSolomon IslandsSomaliaSouth AfricaSouth AsiaSouth Asia (IDA & IBRD)South SudanSpainSri LankaSt. Kitts and NevisSt. LuciaSt. Martin (French part)St. Vincent and the GrenadinesSub-Saharan Africa Sub-Saharan Africa (excluding high income)Sub-Saharan Africa (IDA & IBRD countries)SudanSurinameSwazilandSwedenSwitzerlandSyrian Arab RepublicTajikistanTanzaniaThailandTimor-LesteTogoTongaTrinidad and TobagoTunisiaTurkeyTurkmenistanTurks and Caicos IslandsTuvaluUgandaUkraineUnited Arab EmiratesUnited KingdomUnited StatesUpper middle incomeUruguayUzbekistanVanuatuVenezuela, RBVietnamVirgin Islands (U.S.)West Bank and GazaWorldYemen, Rep.ZambiaZimbabwe Timeline:
This timeline shows a graph from 1971 to 2009 of St. Kitts and Nevis. No data until 1970. Number of actual observations by date: 39.
Source name:
World Development Indicators
Source organization:
European Commission, Joint Research Centre (JRC)/Netherlands Environmental Assessment Agency (PBL). Emission Database for Global Atmospheric Research (EDGAR): http://edgar.jrc.ec.europa.eu/
Categories, topics:
Energy & Mining, Environment
Last updated:
apr 23, 2017
Indicators value changes by year
At the date of observation
Value
Absolute change
Change from previous value
jan 1, 1971
3.577
+3.577
0.0%
jan 1, 1972
3.072
-0.506
-14.14%
jan 1, 1973
2.871
-0.201
-6.54%
jan 1, 1974
2.616
-0.254
-8.86%
jan 1, 1975
2.594
-0.022
-0.86%
jan 1, 1976
2.624
+0.03
1.16%
jan 1, 1977
3.534
+0.91
34.7%
jan 1, 1978
3.903
+0.369
10.44%
jan 1, 1979
3.885
-0.018
-0.46%
jan 1, 1980
4.05
+0.165
4.24%
jan 1, 1981
3.793
-0.257
-6.35%
jan 1, 1982
3.75
-0.043
-1.13%
jan 1, 1983
3.967
+0.217
5.8%
jan 1, 1984
3.244
-0.723
-18.24%
jan 1, 1985
3.4
+0.157
4.83%
jan 1, 1986
2.826
-0.575
-16.9%
jan 1, 1987
2.75
-0.076
-2.68%
jan 1, 1988
2.737
-0.013
-0.46%
jan 1, 1989
2.835
+0.097
3.55%
jan 1, 1990
2.665
-0.169
-5.97%
jan 1, 1991
1.903
-0.762
-28.6%
jan 1, 1992
2.197
+0.294
15.42%
jan 1, 1993
2.931
+0.734
33.42%
jan 1, 1994
2.355
-0.575
-19.63%
jan 1, 1995
2.054
-0.301
-12.8%
jan 1, 1996
2.068
+0.014
0.68%
jan 1, 1997
2.313
+0.246
11.88%
jan 1, 1998
3.194
+0.881
38.07%
jan 1, 1999
2.582
-0.612
-19.15%
jan 1, 2000
2.158
-0.425
-16.45%
jan 1, 2001
2.158
+0.0
0.0%
jan 1, 2002
2.13
-0.028
-1.29%
jan 1, 2003
2.147
+0.017
0.8%
jan 1, 2004
2.152
+0.005
0.22%
jan 1, 2005
2.164
+0.012
0.55%
jan 1, 2006
1.298
-0.866
-40.02%
jan 1, 2007
0.887
-0.411
-31.69%
jan 1, 2008
0.365
-0.521
-58.79%
jan 1, 2009
0.377
+0.012
3.25%
Ranking of countries by current statistics by years


Comments: