29
/
en
AIzaSyAYiBZKx7MnpbEhh9jyipgxe19OcubqV5w
April 1, 2024
133414
Finland
FIN
true
2
1
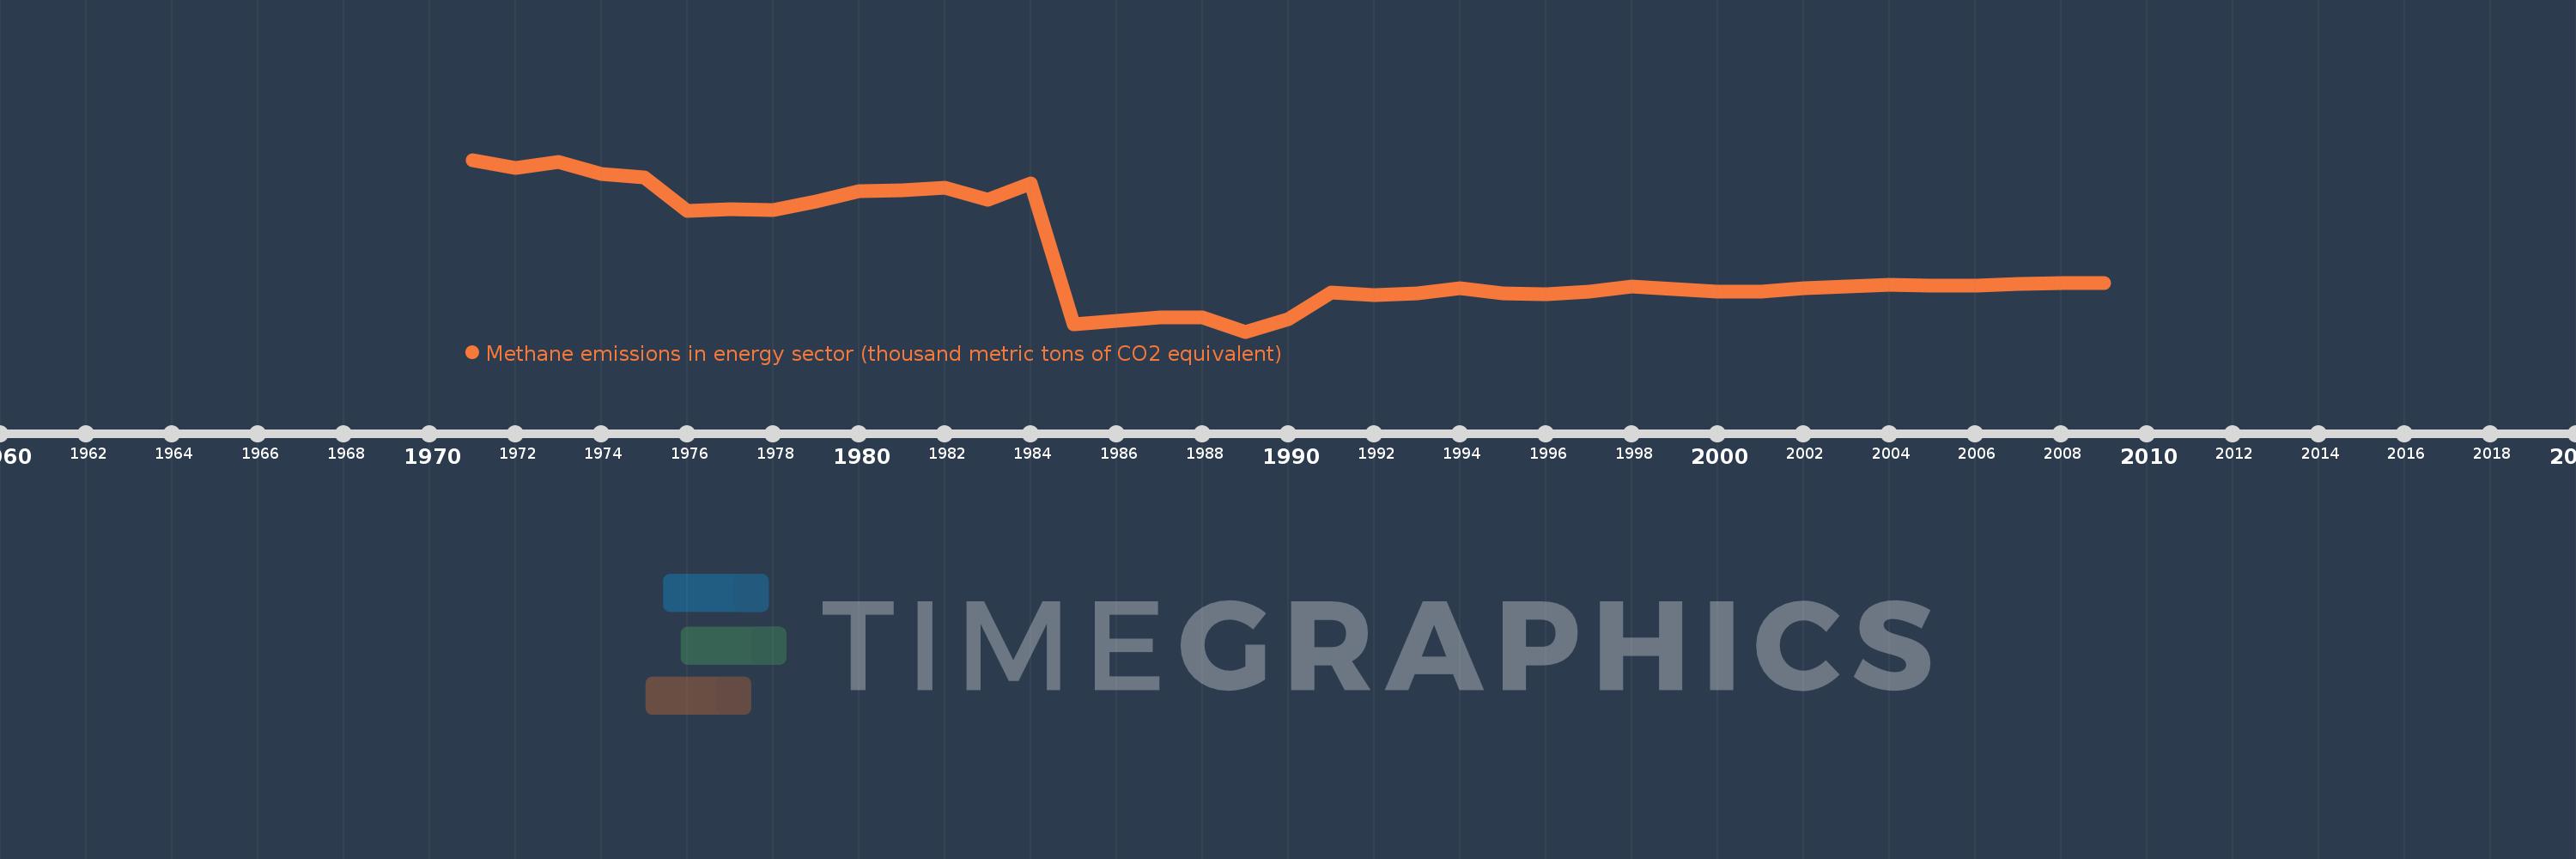
Methane emissions in energy sector (thousand metric tons of CO2 equivalent)
2009,2008,2007,2006,2005,2004,2003,2002,2001,2000,1999,1998,1997,1996,1995,1994,1993,1992,1991,1990,1989,1988,1987,1986,1985,1984,1983,1982,1981,1980,1979,1978,1977,1976,1975,1974,1973,1972,1971
This statistics in other country:
AfghanistanAlbaniaAlgeriaAmerican SamoaAndorraAngolaAntigua and BarbudaArab WorldArgentinaArmeniaArubaAustraliaAustriaAzerbaijanBahamas, TheBahrainBangladeshBarbadosBelarusBelgiumBelizeBeninBermudaBhutanBoliviaBosnia and HerzegovinaBotswanaBrazilBritish Virgin IslandsBrunei DarussalamBulgariaBurkina FasoBurundiCabo VerdeCambodiaCameroonCanadaCaribbean small statesCayman IslandsCentral African RepublicCentral Europe and the BalticsChadChannel IslandsChileChinaColombiaComorosCongo, Dem. Rep.Congo, Rep.Costa RicaCote d'IvoireCroatiaCubaCuracaoCyprusCzech RepublicDenmarkDjiboutiDominicaDominican RepublicEarly-demographic dividendEast Asia & PacificEast Asia & Pacific (excluding high income)East Asia & Pacific (IDA & IBRD countries)EcuadorEgypt, Arab Rep.El SalvadorEquatorial GuineaEritreaEstoniaEthiopiaEuro areaEurope & Central AsiaEurope & Central Asia (excluding high income)Europe & Central Asia (IDA & IBRD countries)European UnionFaroe IslandsFijiFinlandFragile and conflict affected situationsFranceFrench PolynesiaGabonGambia, TheGeorgiaGermanyGhanaGibraltarGreeceGreenlandGrenadaGuamGuatemalaGuineaGuinea-BissauGuyanaHaitiHeavily indebted poor countries (HIPC)High incomeHondurasHong Kong SAR, ChinaHungaryIBRD onlyIcelandIDA & IBRD totalIDA blendIDA onlyIDA totalIndiaIndonesiaIran, Islamic Rep.IraqIrelandIsle of ManIsraelItalyJamaicaJapanJordanKazakhstanKenyaKiribatiKorea, Dem. People’s Rep.Korea, Rep.KosovoKuwaitKyrgyz RepublicLao PDRLate-demographic dividendLatin America & Caribbean Latin America & Caribbean (excluding high income)Latin America & the Caribbean (IDA & IBRD countries)LatviaLeast developed countries: UN classificationLebanonLesothoLiberiaLibyaLiechtensteinLithuaniaLow & middle incomeLow incomeLower middle incomeLuxembourgMacao SAR, ChinaMacedonia, FYRMadagascarMalawiMalaysiaMaldivesMaliMaltaMarshall IslandsMauritaniaMauritiusMexicoMicronesia, Fed. Sts.Middle East & North AfricaMiddle East & North Africa (excluding high income)Middle East & North Africa (IDA & IBRD countries)Middle incomeMoldovaMonacoMongoliaMontenegroMoroccoMozambiqueMyanmarNamibiaNauruNepalNetherlandsNew CaledoniaNew ZealandNicaraguaNigerNigeriaNorth AmericaNorthern Mariana IslandsNorwayOECD membersOmanOther small statesPacific island small statesPakistanPalauPanamaPapua New GuineaParaguayPeruPhilippinesPolandPortugalPost-demographic dividendPre-demographic dividendPuerto RicoQatarRomaniaRussian FederationRwandaSamoaSan MarinoSao Tome and PrincipeSaudi ArabiaSenegalSerbiaSeychellesSierra LeoneSingaporeSint Maarten (Dutch part)Slovak RepublicSloveniaSmall statesSolomon IslandsSomaliaSouth AfricaSouth AsiaSouth Asia (IDA & IBRD)South SudanSpainSri LankaSt. Kitts and NevisSt. LuciaSt. Martin (French part)St. Vincent and the GrenadinesSub-Saharan Africa Sub-Saharan Africa (excluding high income)Sub-Saharan Africa (IDA & IBRD countries)SudanSurinameSwazilandSwedenSwitzerlandSyrian Arab RepublicTajikistanTanzaniaThailandTimor-LesteTogoTongaTrinidad and TobagoTunisiaTurkeyTurkmenistanTurks and Caicos IslandsTuvaluUgandaUkraineUnited Arab EmiratesUnited KingdomUnited StatesUpper middle incomeUruguayUzbekistanVanuatuVenezuela, RBVietnamVirgin Islands (U.S.)West Bank and GazaWorldYemen, Rep.ZambiaZimbabwe Timeline:
This timeline shows a graph from 1971 to 2009 of Finland. No data until 1970. Number of actual observations by date: 39.
Source name:
World Development Indicators
Source organization:
European Commission, Joint Research Centre (JRC)/Netherlands Environmental Assessment Agency (PBL). Emission Database for Global Atmospheric Research (EDGAR): http://edgar.jrc.ec.europa.eu/
Categories, topics:
Energy & Mining, Environment
Last updated:
apr 23, 2017
Indicators value changes by year
Minimum:
486.519
jan 1, 1989
At the date of observation
Value
Absolute change
Change from previous value
jan 1, 1971
1.71K
+1.71K
0.0%
jan 1, 1972
1.654K
-56.355
-3.3%
jan 1, 1973
1.693K
+39.345
2.38%
jan 1, 1974
1.612K
-81.285
-4.8%
jan 1, 1975
1.583K
-28.798
-1.79%
jan 1, 1976
1.344K
-238.974
-15.1%
jan 1, 1977
1.361K
+16.981
1.26%
jan 1, 1978
1.353K
-8.032
-0.59%
jan 1, 1979
1.412K
+59.674
4.41%
jan 1, 1980
1.486K
+73.648
5.21%
jan 1, 1981
1.494K
+7.522
0.51%
jan 1, 1982
1.512K
+18.438
1.23%
jan 1, 1983
1.427K
-84.637
-5.6%
jan 1, 1984
1.541K
+113.209
7.93%
jan 1, 1985
539.113
-1.001K
-65.01%
jan 1, 1986
560.747
+21.633
4.01%
jan 1, 1987
586.912
+26.165
4.67%
jan 1, 1988
587.275
+0.363
0.06%
jan 1, 1989
486.519
-100.757
-17.16%
jan 1, 1990
577.657
+91.138
18.73%
jan 1, 1991
765.903
+188.246
32.59%
jan 1, 1992
749.043
-16.86
-2.2%
jan 1, 1993
759.933
+10.889
1.45%
jan 1, 1994
793.517
+33.584
4.42%
jan 1, 1995
756.525
-36.992
-4.66%
jan 1, 1996
751.279
-5.246
-0.69%
jan 1, 1997
771.972
+20.692
2.75%
jan 1, 1998
805.437
+33.465
4.34%
jan 1, 1999
788.554
-16.883
-2.1%
jan 1, 2000
769.681
-18.873
-2.39%
jan 1, 2001
769.978
+0.297
0.04%
jan 1, 2002
792.823
+22.845
2.97%
jan 1, 2003
808.728
+15.905
2.01%
jan 1, 2004
820.663
+11.935
1.48%
jan 1, 2005
813.492
-7.171
-0.87%
jan 1, 2006
816.502
+3.01
0.37%
jan 1, 2007
826.196
+9.694
1.19%
jan 1, 2008
829.544
+3.348
0.41%
jan 1, 2009
833.973
+4.43
0.53%
Ranking of countries by current statistics by years


Comments: