29
/
en
AIzaSyAYiBZKx7MnpbEhh9jyipgxe19OcubqV5w
April 1, 2024
162855
Jamaica
JAM
true
2
1
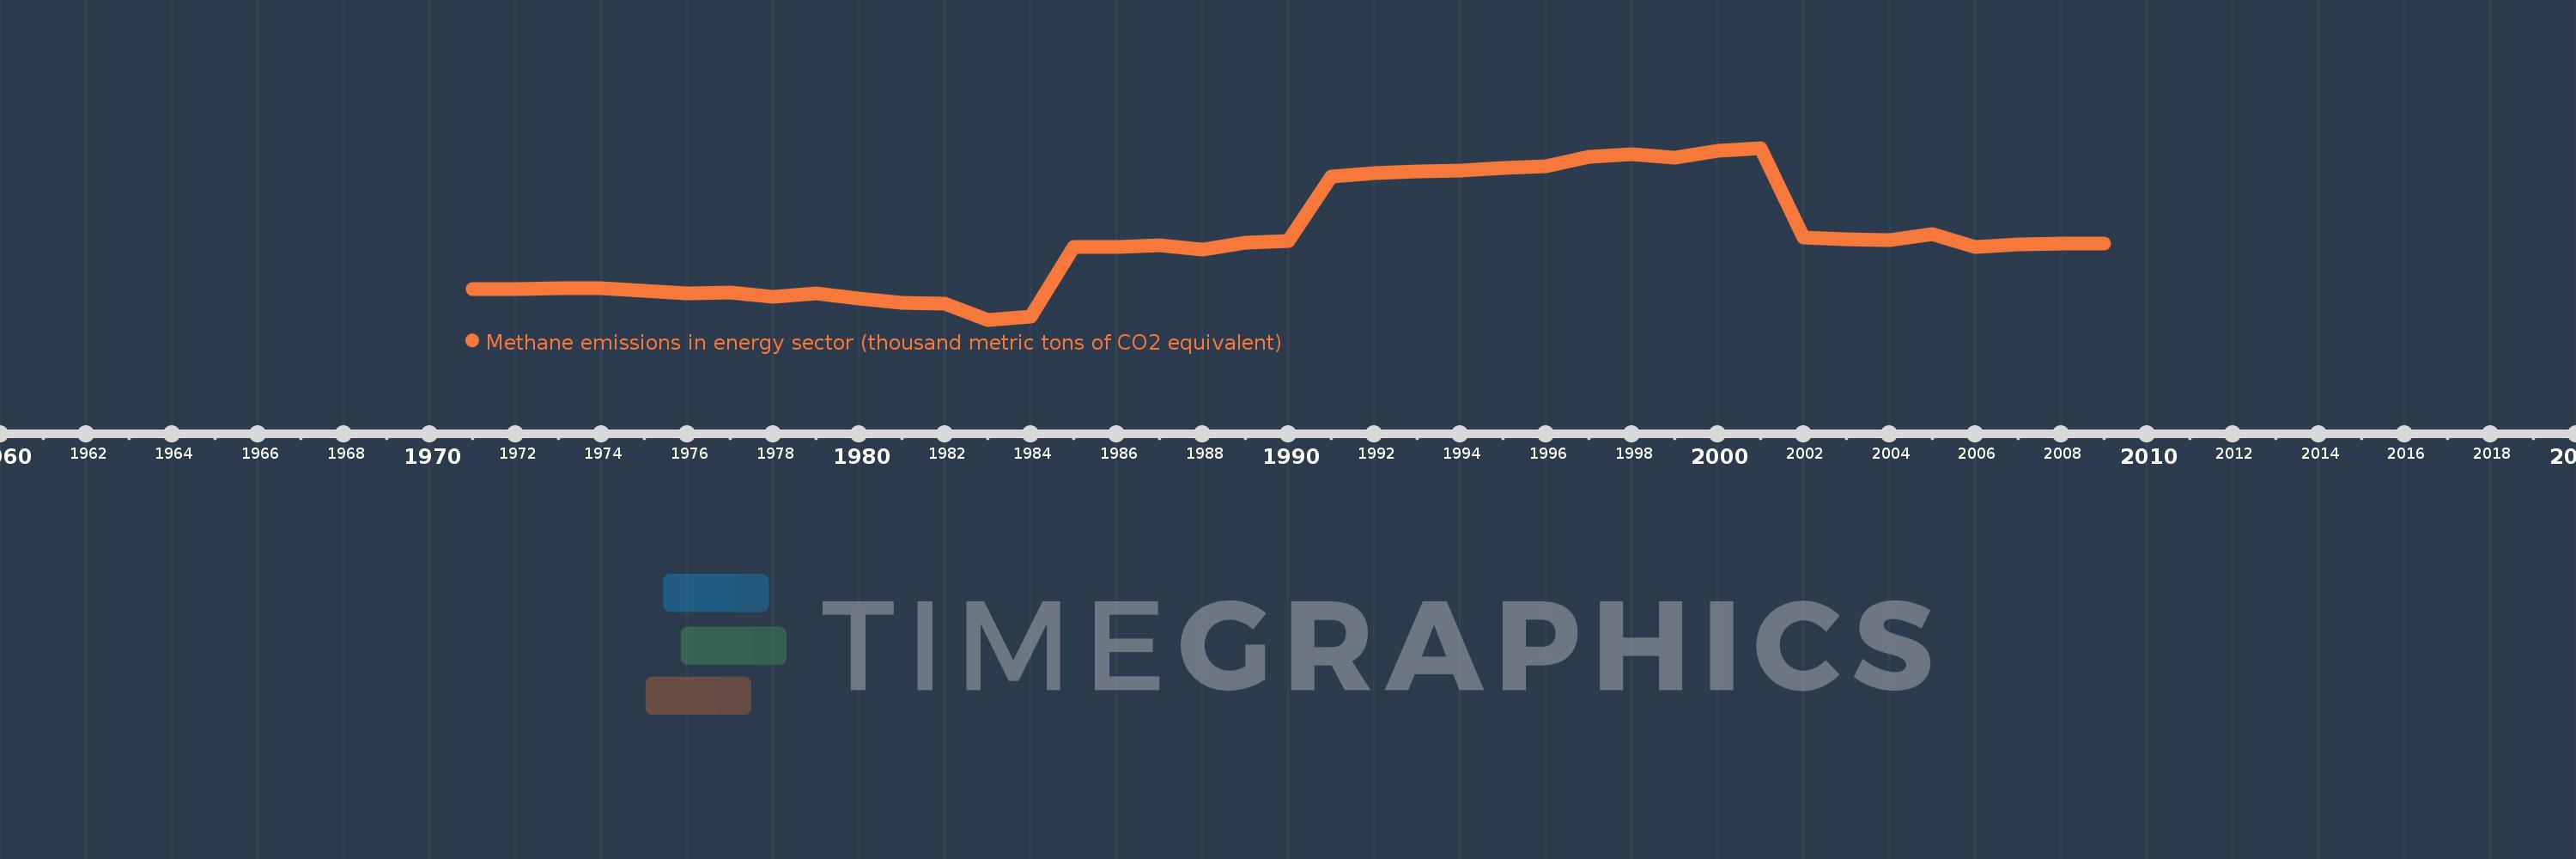
Methane emissions in energy sector (thousand metric tons of CO2 equivalent)
2009,2008,2007,2006,2005,2004,2003,2002,2001,2000,1999,1998,1997,1996,1995,1994,1993,1992,1991,1990,1989,1988,1987,1986,1985,1984,1983,1982,1981,1980,1979,1978,1977,1976,1975,1974,1973,1972,1971
This statistics in other country:
AfghanistanAlbaniaAlgeriaAmerican SamoaAndorraAngolaAntigua and BarbudaArab WorldArgentinaArmeniaArubaAustraliaAustriaAzerbaijanBahamas, TheBahrainBangladeshBarbadosBelarusBelgiumBelizeBeninBermudaBhutanBoliviaBosnia and HerzegovinaBotswanaBrazilBritish Virgin IslandsBrunei DarussalamBulgariaBurkina FasoBurundiCabo VerdeCambodiaCameroonCanadaCaribbean small statesCayman IslandsCentral African RepublicCentral Europe and the BalticsChadChannel IslandsChileChinaColombiaComorosCongo, Dem. Rep.Congo, Rep.Costa RicaCote d'IvoireCroatiaCubaCuracaoCyprusCzech RepublicDenmarkDjiboutiDominicaDominican RepublicEarly-demographic dividendEast Asia & PacificEast Asia & Pacific (excluding high income)East Asia & Pacific (IDA & IBRD countries)EcuadorEgypt, Arab Rep.El SalvadorEquatorial GuineaEritreaEstoniaEthiopiaEuro areaEurope & Central AsiaEurope & Central Asia (excluding high income)Europe & Central Asia (IDA & IBRD countries)European UnionFaroe IslandsFijiFinlandFragile and conflict affected situationsFranceFrench PolynesiaGabonGambia, TheGeorgiaGermanyGhanaGibraltarGreeceGreenlandGrenadaGuamGuatemalaGuineaGuinea-BissauGuyanaHaitiHeavily indebted poor countries (HIPC)High incomeHondurasHong Kong SAR, ChinaHungaryIBRD onlyIcelandIDA & IBRD totalIDA blendIDA onlyIDA totalIndiaIndonesiaIran, Islamic Rep.IraqIrelandIsle of ManIsraelItalyJamaicaJapanJordanKazakhstanKenyaKiribatiKorea, Dem. People’s Rep.Korea, Rep.KosovoKuwaitKyrgyz RepublicLao PDRLate-demographic dividendLatin America & Caribbean Latin America & Caribbean (excluding high income)Latin America & the Caribbean (IDA & IBRD countries)LatviaLeast developed countries: UN classificationLebanonLesothoLiberiaLibyaLiechtensteinLithuaniaLow & middle incomeLow incomeLower middle incomeLuxembourgMacao SAR, ChinaMacedonia, FYRMadagascarMalawiMalaysiaMaldivesMaliMaltaMarshall IslandsMauritaniaMauritiusMexicoMicronesia, Fed. Sts.Middle East & North AfricaMiddle East & North Africa (excluding high income)Middle East & North Africa (IDA & IBRD countries)Middle incomeMoldovaMonacoMongoliaMontenegroMoroccoMozambiqueMyanmarNamibiaNauruNepalNetherlandsNew CaledoniaNew ZealandNicaraguaNigerNigeriaNorth AmericaNorthern Mariana IslandsNorwayOECD membersOmanOther small statesPacific island small statesPakistanPalauPanamaPapua New GuineaParaguayPeruPhilippinesPolandPortugalPost-demographic dividendPre-demographic dividendPuerto RicoQatarRomaniaRussian FederationRwandaSamoaSan MarinoSao Tome and PrincipeSaudi ArabiaSenegalSerbiaSeychellesSierra LeoneSingaporeSint Maarten (Dutch part)Slovak RepublicSloveniaSmall statesSolomon IslandsSomaliaSouth AfricaSouth AsiaSouth Asia (IDA & IBRD)South SudanSpainSri LankaSt. Kitts and NevisSt. LuciaSt. Martin (French part)St. Vincent and the GrenadinesSub-Saharan Africa Sub-Saharan Africa (excluding high income)Sub-Saharan Africa (IDA & IBRD countries)SudanSurinameSwazilandSwedenSwitzerlandSyrian Arab RepublicTajikistanTanzaniaThailandTimor-LesteTogoTongaTrinidad and TobagoTunisiaTurkeyTurkmenistanTurks and Caicos IslandsTuvaluUgandaUkraineUnited Arab EmiratesUnited KingdomUnited StatesUpper middle incomeUruguayUzbekistanVanuatuVenezuela, RBVietnamVirgin Islands (U.S.)West Bank and GazaWorldYemen, Rep.ZambiaZimbabwe Timeline:
This timeline shows a graph from 1971 to 2009 of Jamaica. No data until 1970. Number of actual observations by date: 39.
Source name:
World Development Indicators
Source organization:
European Commission, Joint Research Centre (JRC)/Netherlands Environmental Assessment Agency (PBL). Emission Database for Global Atmospheric Research (EDGAR): http://edgar.jrc.ec.europa.eu/
Categories, topics:
Energy & Mining, Environment
Last updated:
apr 23, 2017
Indicators value changes by year
Minimum:
64.753
jan 1, 1983
Maximum:
267.408
jan 1, 2001
At the date of observation
Value
Absolute change
Change from previous value
jan 1, 1971
100.978
+100.978
0.0%
jan 1, 1972
100.8
-0.178
-0.18%
jan 1, 1973
102.386
+1.586
1.57%
jan 1, 1974
101.916
-0.47
-0.46%
jan 1, 1975
99.158
-2.758
-2.71%
jan 1, 1976
95.504
-3.653
-3.68%
jan 1, 1977
97.09
+1.586
1.66%
jan 1, 1978
91.761
-5.33
-5.49%
jan 1, 1979
96.359
+4.598
5.01%
jan 1, 1980
89.573
-6.785
-7.04%
jan 1, 1981
84.574
-5.0
-5.58%
jan 1, 1982
83.253
-1.32
-1.56%
jan 1, 1983
64.753
-18.5
-22.22%
jan 1, 1984
68.304
+3.551
5.48%
jan 1, 1985
150.958
+82.655
121.01%
jan 1, 1986
150.583
-0.376
-0.25%
jan 1, 1987
152.446
+1.864
1.24%
jan 1, 1988
147.648
-4.798
-3.15%
jan 1, 1989
155.495
+7.846
5.31%
jan 1, 1990
157.477
+1.982
1.27%
jan 1, 1991
233.68
+76.203
48.39%
jan 1, 1992
237.956
+4.277
1.83%
jan 1, 1993
239.891
+1.935
0.81%
jan 1, 1994
240.673
+0.782
0.33%
jan 1, 1995
244.035
+3.361
1.4%
jan 1, 1996
245.341
+1.306
0.54%
jan 1, 1997
256.668
+11.327
4.62%
jan 1, 1998
259.58
+2.912
1.13%
jan 1, 1999
255.49
-4.09
-1.58%
jan 1, 2000
264.172
+8.682
3.4%
jan 1, 2001
267.408
+3.236
1.22%
jan 1, 2002
162.171
-105.237
-39.35%
jan 1, 2003
160.148
-2.023
-1.25%
jan 1, 2004
158.212
-1.936
-1.21%
jan 1, 2005
166.228
+8.015
5.07%
jan 1, 2006
150.108
-16.12
-9.7%
jan 1, 2007
154.1
+3.992
2.66%
jan 1, 2008
154.451
+0.351
0.23%
jan 1, 2009
154.332
-0.118
-0.08%
Ranking of countries by current statistics by years


Comments: