29
/
en
AIzaSyAYiBZKx7MnpbEhh9jyipgxe19OcubqV5w
April 1, 2024
38364
IDA blend
IDB
false
2
1
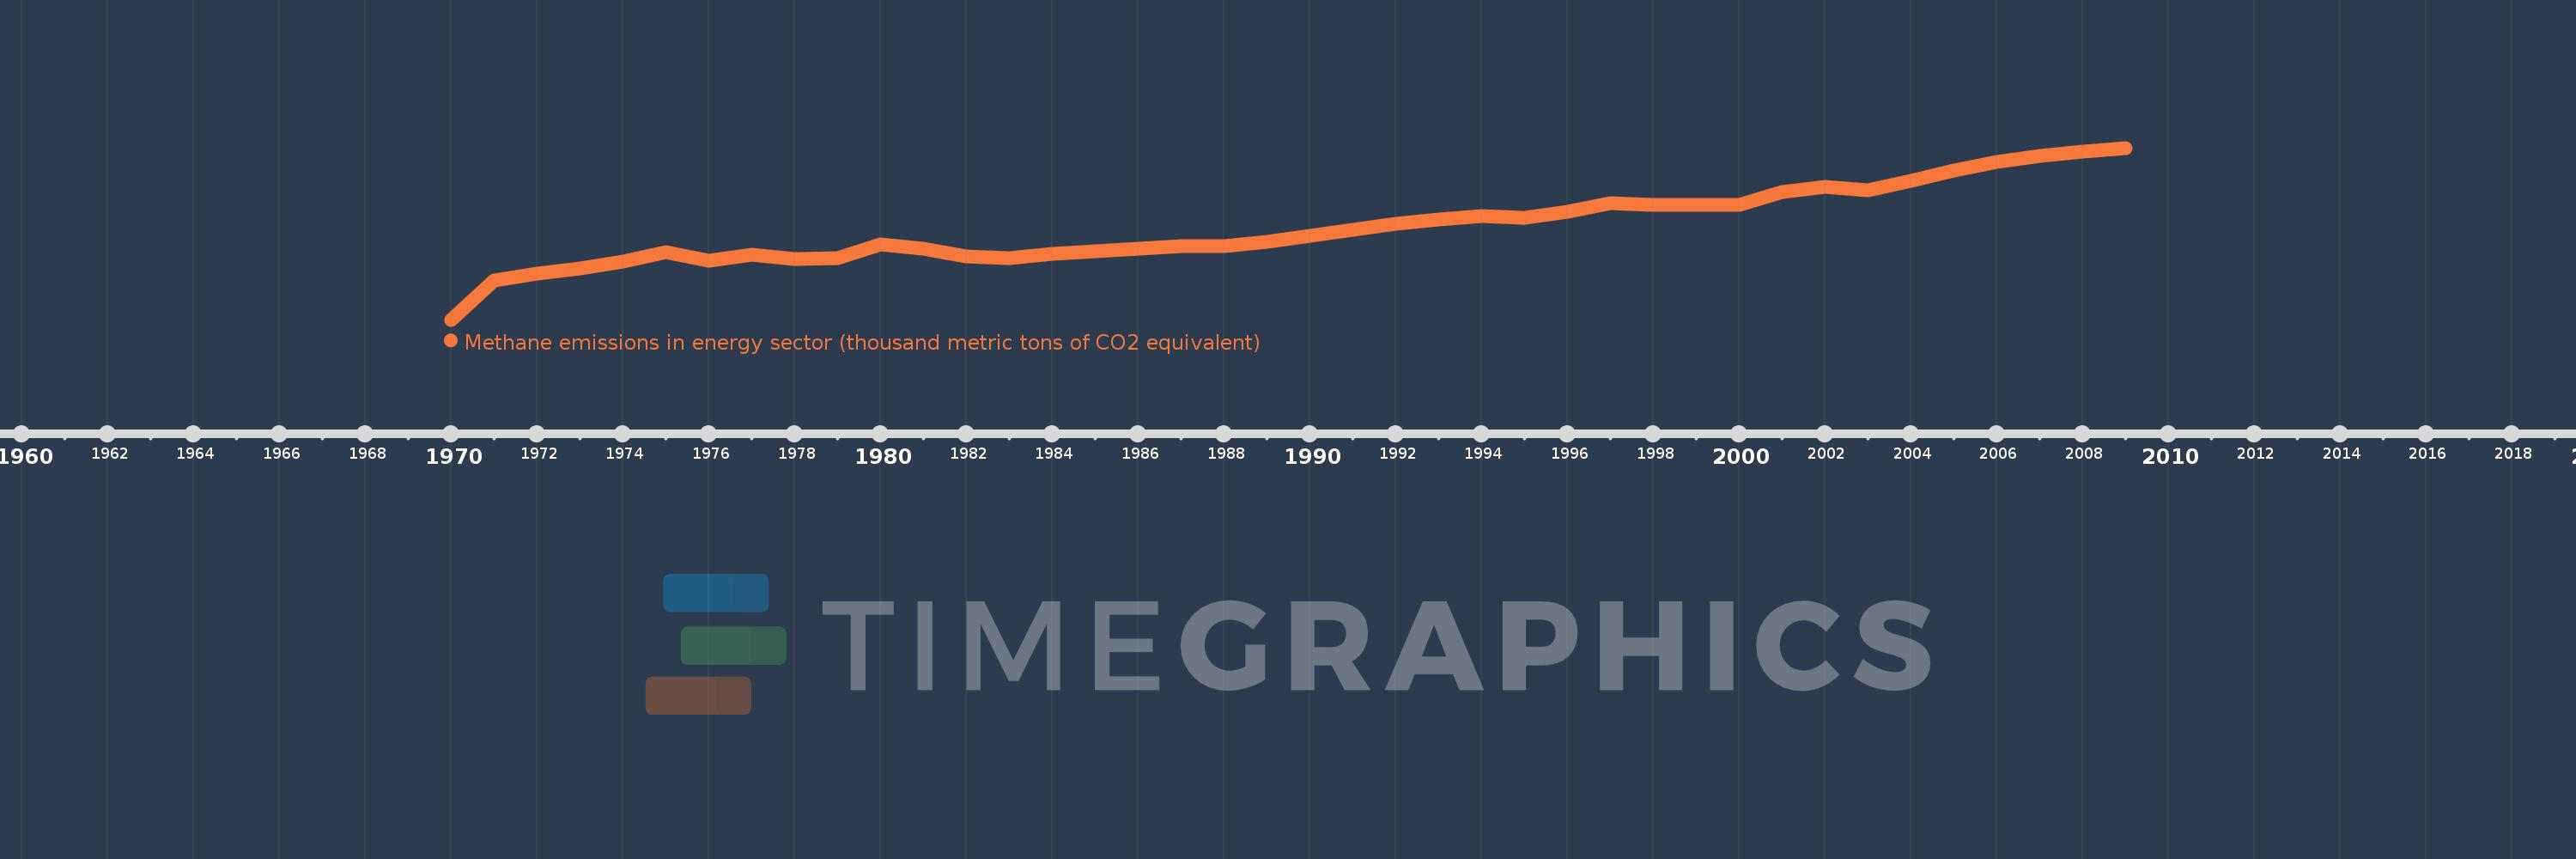
Methane emissions in energy sector (thousand metric tons of CO2 equivalent)
2009,2008,2007,2006,2005,2004,2003,2002,2001,2000,1999,1998,1997,1996,1995,1994,1993,1992,1991,1990,1989,1988,1987,1986,1985,1984,1983,1982,1981,1980,1979,1978,1977,1976,1975,1974,1973,1972,1971,1970
This statistics in other country:
AfghanistanAlbaniaAlgeriaAmerican SamoaAndorraAngolaAntigua and BarbudaArab WorldArgentinaArmeniaArubaAustraliaAustriaAzerbaijanBahamas, TheBahrainBangladeshBarbadosBelarusBelgiumBelizeBeninBermudaBhutanBoliviaBosnia and HerzegovinaBotswanaBrazilBritish Virgin IslandsBrunei DarussalamBulgariaBurkina FasoBurundiCabo VerdeCambodiaCameroonCanadaCaribbean small statesCayman IslandsCentral African RepublicCentral Europe and the BalticsChadChannel IslandsChileChinaColombiaComorosCongo, Dem. Rep.Congo, Rep.Costa RicaCote d'IvoireCroatiaCubaCuracaoCyprusCzech RepublicDenmarkDjiboutiDominicaDominican RepublicEarly-demographic dividendEast Asia & PacificEast Asia & Pacific (excluding high income)East Asia & Pacific (IDA & IBRD countries)EcuadorEgypt, Arab Rep.El SalvadorEquatorial GuineaEritreaEstoniaEthiopiaEuro areaEurope & Central AsiaEurope & Central Asia (excluding high income)Europe & Central Asia (IDA & IBRD countries)European UnionFaroe IslandsFijiFinlandFragile and conflict affected situationsFranceFrench PolynesiaGabonGambia, TheGeorgiaGermanyGhanaGibraltarGreeceGreenlandGrenadaGuamGuatemalaGuineaGuinea-BissauGuyanaHaitiHeavily indebted poor countries (HIPC)High incomeHondurasHong Kong SAR, ChinaHungaryIBRD onlyIcelandIDA & IBRD totalIDA blendIDA onlyIDA totalIndiaIndonesiaIran, Islamic Rep.IraqIrelandIsle of ManIsraelItalyJamaicaJapanJordanKazakhstanKenyaKiribatiKorea, Dem. People’s Rep.Korea, Rep.KosovoKuwaitKyrgyz RepublicLao PDRLate-demographic dividendLatin America & Caribbean Latin America & Caribbean (excluding high income)Latin America & the Caribbean (IDA & IBRD countries)LatviaLeast developed countries: UN classificationLebanonLesothoLiberiaLibyaLiechtensteinLithuaniaLow & middle incomeLow incomeLower middle incomeLuxembourgMacao SAR, ChinaMacedonia, FYRMadagascarMalawiMalaysiaMaldivesMaliMaltaMarshall IslandsMauritaniaMauritiusMexicoMicronesia, Fed. Sts.Middle East & North AfricaMiddle East & North Africa (excluding high income)Middle East & North Africa (IDA & IBRD countries)Middle incomeMoldovaMonacoMongoliaMontenegroMoroccoMozambiqueMyanmarNamibiaNauruNepalNetherlandsNew CaledoniaNew ZealandNicaraguaNigerNigeriaNorth AmericaNorthern Mariana IslandsNorwayOECD membersOmanOther small statesPacific island small statesPakistanPalauPanamaPapua New GuineaParaguayPeruPhilippinesPolandPortugalPost-demographic dividendPre-demographic dividendPuerto RicoQatarRomaniaRussian FederationRwandaSamoaSan MarinoSao Tome and PrincipeSaudi ArabiaSenegalSerbiaSeychellesSierra LeoneSingaporeSint Maarten (Dutch part)Slovak RepublicSloveniaSmall statesSolomon IslandsSomaliaSouth AfricaSouth AsiaSouth Asia (IDA & IBRD)South SudanSpainSri LankaSt. Kitts and NevisSt. LuciaSt. Martin (French part)St. Vincent and the GrenadinesSub-Saharan Africa Sub-Saharan Africa (excluding high income)Sub-Saharan Africa (IDA & IBRD countries)SudanSurinameSwazilandSwedenSwitzerlandSyrian Arab RepublicTajikistanTanzaniaThailandTimor-LesteTogoTongaTrinidad and TobagoTunisiaTurkeyTurkmenistanTurks and Caicos IslandsTuvaluUgandaUkraineUnited Arab EmiratesUnited KingdomUnited StatesUpper middle incomeUruguayUzbekistanVanuatuVenezuela, RBVietnamVirgin Islands (U.S.)West Bank and GazaWorldYemen, Rep.ZambiaZimbabwe Timeline:
This timeline shows a graph from 1970 to 2009 of IDA blend. No data until 1969. Number of actual observations by date: 40.
Source name:
World Development Indicators
Source organization:
European Commission, Joint Research Centre (JRC)/Netherlands Environmental Assessment Agency (PBL). Emission Database for Global Atmospheric Research (EDGAR): http://edgar.jrc.ec.europa.eu/
Categories, topics:
Energy & Mining, Environment
Last updated:
apr 23, 2017
Indicators value changes by year
Maximum:
162.77K
jan 1, 2009
At the date of observation
Value
Absolute change
Change from previous value
jan 1, 1971
37.165K
+37.165K
%
jan 1, 1972
43.325K
+6.16K
16.58%
jan 1, 1973
48.838K
+5.512K
12.72%
jan 1, 1974
55.488K
+6.65K
13.62%
jan 1, 1975
64.402K
+8.914K
16.06%
jan 1, 1976
56.018K
-8.383K
-13.02%
jan 1, 1977
61.511K
+5.493K
9.81%
jan 1, 1978
57.553K
-3.958K
-6.43%
jan 1, 1979
58.359K
+805.783
1.4%
jan 1, 1980
71.607K
+13.248K
22.7%
jan 1, 1981
67.233K
-4.374K
-6.11%
jan 1, 1982
59.959K
-7.274K
-10.82%
jan 1, 1983
58.411K
-1.547K
-2.58%
jan 1, 1984
62.287K
+3.876K
6.64%
jan 1, 1985
64.974K
+2.687K
4.31%
jan 1, 1986
67.042K
+2.068K
3.18%
jan 1, 1987
70.141K
+3.099K
4.62%
jan 1, 1988
70.091K
-49.907
-0.07%
jan 1, 1989
74.015K
+3.924K
5.6%
jan 1, 1990
79.806K
+5.791K
7.82%
jan 1, 1991
85.307K
+5.501K
6.89%
jan 1, 1992
90.509K
+5.202K
6.1%
jan 1, 1993
94.634K
+4.125K
4.56%
jan 1, 1994
98.296K
+3.663K
3.87%
jan 1, 1995
96.965K
-1.331K
-1.35%
jan 1, 1996
102.365K
+5.4K
5.57%
jan 1, 1997
110.363K
+7.998K
7.81%
jan 1, 1998
109.179K
-1.184K
-1.07%
jan 1, 1999
109.097K
-81.565
-0.07%
jan 1, 2000
108.612K
-485.168
-0.44%
jan 1, 2001
121.06K
+12.448K
11.46%
jan 1, 2002
125.507K
+4.448K
3.67%
jan 1, 2003
123.053K
-2.455K
-1.96%
jan 1, 2004
131.533K
+8.48K
6.89%
jan 1, 2005
141.704K
+10.171K
7.73%
jan 1, 2006
149.218K
+7.514K
5.3%
jan 1, 2007
155.332K
+6.114K
4.1%
jan 1, 2008
158.879K
+3.547K
2.28%
jan 1, 2009
162.77K
+3.891K
2.45%
Ranking of countries by current statistics by years


Comments: