29
/
en
AIzaSyAYiBZKx7MnpbEhh9jyipgxe19OcubqV5w
April 1, 2024
127566
Equatorial Guinea
GNQ
true
2
1
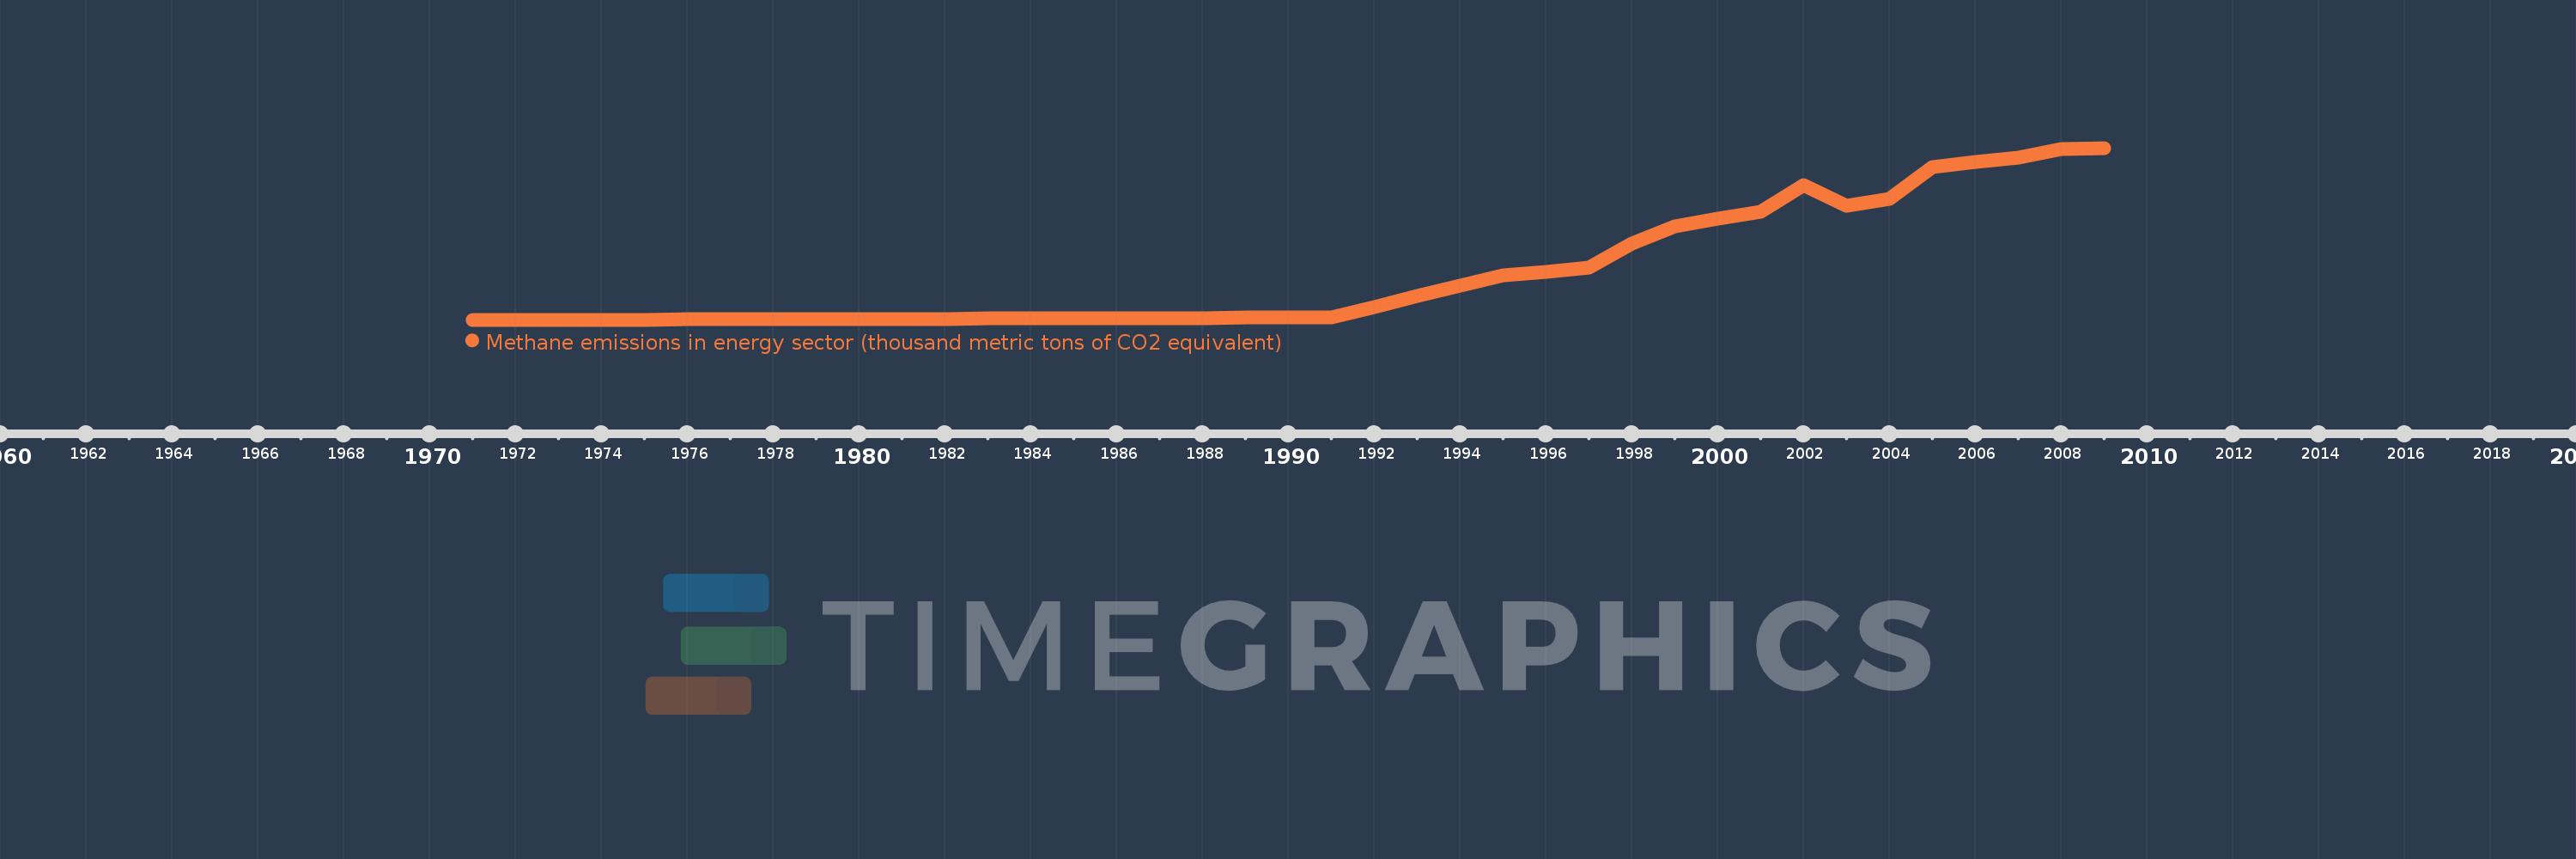
Methane emissions in energy sector (thousand metric tons of CO2 equivalent)
2009,2008,2007,2006,2005,2004,2003,2002,2001,2000,1999,1998,1997,1996,1995,1994,1993,1992,1991,1990,1989,1988,1987,1986,1985,1984,1983,1982,1981,1980,1979,1978,1977,1976,1975,1974,1973,1972,1971
This statistics in other country:
AfghanistanAlbaniaAlgeriaAmerican SamoaAndorraAngolaAntigua and BarbudaArab WorldArgentinaArmeniaArubaAustraliaAustriaAzerbaijanBahamas, TheBahrainBangladeshBarbadosBelarusBelgiumBelizeBeninBermudaBhutanBoliviaBosnia and HerzegovinaBotswanaBrazilBritish Virgin IslandsBrunei DarussalamBulgariaBurkina FasoBurundiCabo VerdeCambodiaCameroonCanadaCaribbean small statesCayman IslandsCentral African RepublicCentral Europe and the BalticsChadChannel IslandsChileChinaColombiaComorosCongo, Dem. Rep.Congo, Rep.Costa RicaCote d'IvoireCroatiaCubaCuracaoCyprusCzech RepublicDenmarkDjiboutiDominicaDominican RepublicEarly-demographic dividendEast Asia & PacificEast Asia & Pacific (excluding high income)East Asia & Pacific (IDA & IBRD countries)EcuadorEgypt, Arab Rep.El SalvadorEquatorial GuineaEritreaEstoniaEthiopiaEuro areaEurope & Central AsiaEurope & Central Asia (excluding high income)Europe & Central Asia (IDA & IBRD countries)European UnionFaroe IslandsFijiFinlandFragile and conflict affected situationsFranceFrench PolynesiaGabonGambia, TheGeorgiaGermanyGhanaGibraltarGreeceGreenlandGrenadaGuamGuatemalaGuineaGuinea-BissauGuyanaHaitiHeavily indebted poor countries (HIPC)High incomeHondurasHong Kong SAR, ChinaHungaryIBRD onlyIcelandIDA & IBRD totalIDA blendIDA onlyIDA totalIndiaIndonesiaIran, Islamic Rep.IraqIrelandIsle of ManIsraelItalyJamaicaJapanJordanKazakhstanKenyaKiribatiKorea, Dem. People’s Rep.Korea, Rep.KosovoKuwaitKyrgyz RepublicLao PDRLate-demographic dividendLatin America & Caribbean Latin America & Caribbean (excluding high income)Latin America & the Caribbean (IDA & IBRD countries)LatviaLeast developed countries: UN classificationLebanonLesothoLiberiaLibyaLiechtensteinLithuaniaLow & middle incomeLow incomeLower middle incomeLuxembourgMacao SAR, ChinaMacedonia, FYRMadagascarMalawiMalaysiaMaldivesMaliMaltaMarshall IslandsMauritaniaMauritiusMexicoMicronesia, Fed. Sts.Middle East & North AfricaMiddle East & North Africa (excluding high income)Middle East & North Africa (IDA & IBRD countries)Middle incomeMoldovaMonacoMongoliaMontenegroMoroccoMozambiqueMyanmarNamibiaNauruNepalNetherlandsNew CaledoniaNew ZealandNicaraguaNigerNigeriaNorth AmericaNorthern Mariana IslandsNorwayOECD membersOmanOther small statesPacific island small statesPakistanPalauPanamaPapua New GuineaParaguayPeruPhilippinesPolandPortugalPost-demographic dividendPre-demographic dividendPuerto RicoQatarRomaniaRussian FederationRwandaSamoaSan MarinoSao Tome and PrincipeSaudi ArabiaSenegalSerbiaSeychellesSierra LeoneSingaporeSint Maarten (Dutch part)Slovak RepublicSloveniaSmall statesSolomon IslandsSomaliaSouth AfricaSouth AsiaSouth Asia (IDA & IBRD)South SudanSpainSri LankaSt. Kitts and NevisSt. LuciaSt. Martin (French part)St. Vincent and the GrenadinesSub-Saharan Africa Sub-Saharan Africa (excluding high income)Sub-Saharan Africa (IDA & IBRD countries)SudanSurinameSwazilandSwedenSwitzerlandSyrian Arab RepublicTajikistanTanzaniaThailandTimor-LesteTogoTongaTrinidad and TobagoTunisiaTurkeyTurkmenistanTurks and Caicos IslandsTuvaluUgandaUkraineUnited Arab EmiratesUnited KingdomUnited StatesUpper middle incomeUruguayUzbekistanVanuatuVenezuela, RBVietnamVirgin Islands (U.S.)West Bank and GazaWorldYemen, Rep.ZambiaZimbabwe Timeline:
This timeline shows a graph from 1971 to 2009 of Equatorial Guinea. No data until 1970. Number of actual observations by date: 39.
Source name:
World Development Indicators
Source organization:
European Commission, Joint Research Centre (JRC)/Netherlands Environmental Assessment Agency (PBL). Emission Database for Global Atmospheric Research (EDGAR): http://edgar.jrc.ec.europa.eu/
Categories, topics:
Energy & Mining, Environment
Last updated:
apr 23, 2017
Indicators value changes by year
Minimum:
39.212
jan 1, 1971
Maximum:
2.539K
jan 1, 2009
At the date of observation
Value
Absolute change
Change from previous value
jan 1, 1971
39.212
+39.212
0.0%
jan 1, 1972
39.908
+0.696
1.77%
jan 1, 1973
40.167
+0.259
0.65%
jan 1, 1974
40.848
+0.681
1.69%
jan 1, 1975
41.561
+0.713
1.75%
jan 1, 1976
42.92
+1.359
3.27%
jan 1, 1977
44.656
+1.737
4.05%
jan 1, 1978
46.04
+1.383
3.1%
jan 1, 1979
47.267
+1.227
2.66%
jan 1, 1980
48.806
+1.54
3.26%
jan 1, 1981
50.585
+1.778
3.64%
jan 1, 1982
52.332
+1.747
3.45%
jan 1, 1983
54.628
+2.297
4.39%
jan 1, 1984
57.222
+2.593
4.75%
jan 1, 1985
59.1
+1.878
3.28%
jan 1, 1986
61.128
+2.029
3.43%
jan 1, 1987
63.302
+2.174
3.56%
jan 1, 1988
64.439
+1.136
1.8%
jan 1, 1989
68.11
+3.672
5.7%
jan 1, 1990
70.573
+2.463
3.62%
jan 1, 1991
73.101
+2.528
3.58%
jan 1, 1992
225.13
+152.029
207.97%
jan 1, 1993
381.642
+156.513
69.52%
jan 1, 1994
537.101
+155.458
40.73%
jan 1, 1995
688.52
+151.419
28.19%
jan 1, 1996
730.324
+41.805
6.07%
jan 1, 1997
800.332
+70.007
9.59%
jan 1, 1998
1.153K
+352.816
44.08%
jan 1, 1999
1.401K
+247.766
21.49%
jan 1, 2000
1.512K
+111.555
7.96%
jan 1, 2001
1.612K
+99.339
6.57%
jan 1, 2002
2.002K
+390.37
24.22%
jan 1, 2003
1.701K
-301.027
-15.04%
jan 1, 2004
1.802K
+100.37
5.9%
jan 1, 2005
2.265K
+463.506
25.73%
jan 1, 2006
2.33K
+65.218
2.88%
jan 1, 2007
2.395K
+64.782
2.78%
jan 1, 2008
2.528K
+132.984
5.55%
jan 1, 2009
2.539K
+10.68
0.42%
Ranking of countries by current statistics by years


Comments: