29
/
en
AIzaSyAYiBZKx7MnpbEhh9jyipgxe19OcubqV5w
April 1, 2024
240703
Singapore
SGP
true
2
1
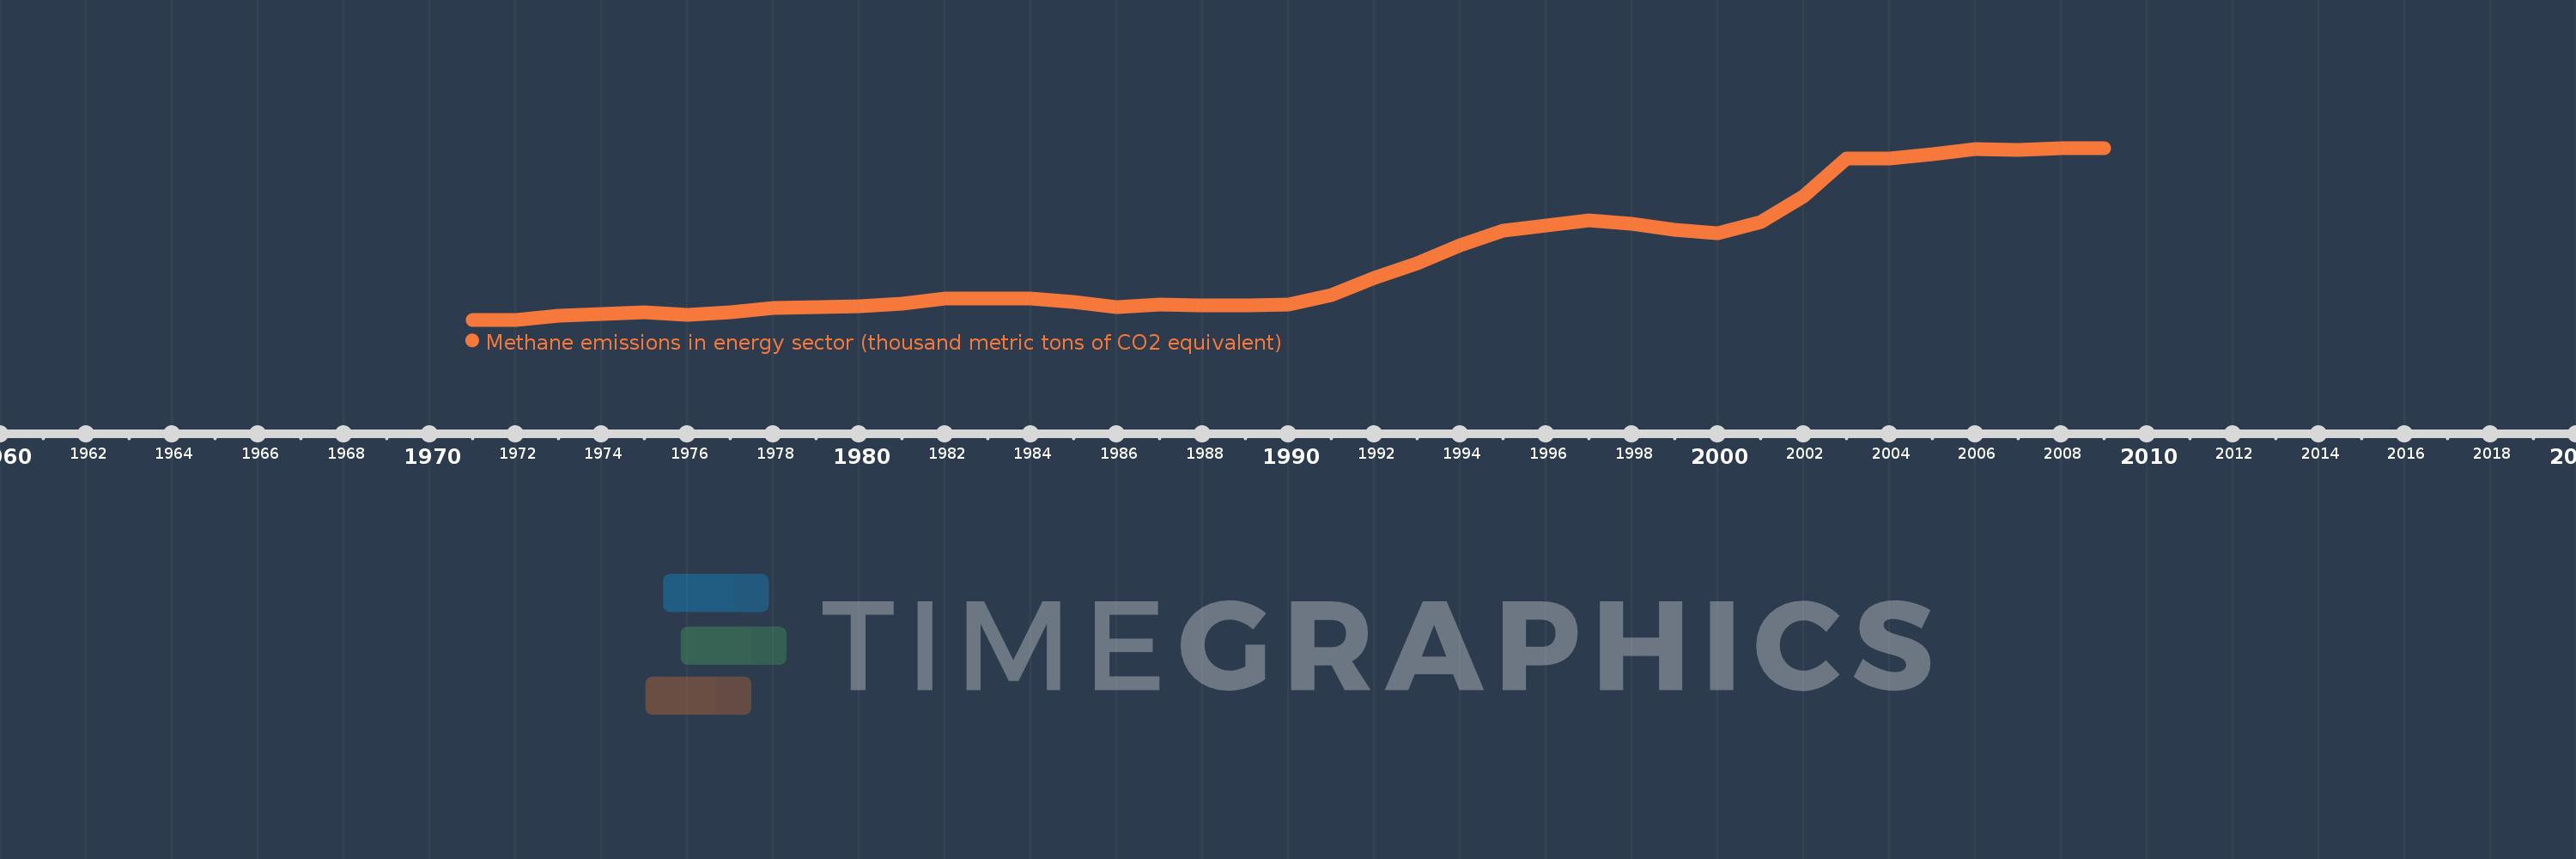
Methane emissions in energy sector (thousand metric tons of CO2 equivalent)
2009,2008,2007,2006,2005,2004,2003,2002,2001,2000,1999,1998,1997,1996,1995,1994,1993,1992,1991,1990,1989,1988,1987,1986,1985,1984,1983,1982,1981,1980,1979,1978,1977,1976,1975,1974,1973,1972,1971
This statistics in other country:
AfghanistanAlbaniaAlgeriaAmerican SamoaAndorraAngolaAntigua and BarbudaArab WorldArgentinaArmeniaArubaAustraliaAustriaAzerbaijanBahamas, TheBahrainBangladeshBarbadosBelarusBelgiumBelizeBeninBermudaBhutanBoliviaBosnia and HerzegovinaBotswanaBrazilBritish Virgin IslandsBrunei DarussalamBulgariaBurkina FasoBurundiCabo VerdeCambodiaCameroonCanadaCaribbean small statesCayman IslandsCentral African RepublicCentral Europe and the BalticsChadChannel IslandsChileChinaColombiaComorosCongo, Dem. Rep.Congo, Rep.Costa RicaCote d'IvoireCroatiaCubaCuracaoCyprusCzech RepublicDenmarkDjiboutiDominicaDominican RepublicEarly-demographic dividendEast Asia & PacificEast Asia & Pacific (excluding high income)East Asia & Pacific (IDA & IBRD countries)EcuadorEgypt, Arab Rep.El SalvadorEquatorial GuineaEritreaEstoniaEthiopiaEuro areaEurope & Central AsiaEurope & Central Asia (excluding high income)Europe & Central Asia (IDA & IBRD countries)European UnionFaroe IslandsFijiFinlandFragile and conflict affected situationsFranceFrench PolynesiaGabonGambia, TheGeorgiaGermanyGhanaGibraltarGreeceGreenlandGrenadaGuamGuatemalaGuineaGuinea-BissauGuyanaHaitiHeavily indebted poor countries (HIPC)High incomeHondurasHong Kong SAR, ChinaHungaryIBRD onlyIcelandIDA & IBRD totalIDA blendIDA onlyIDA totalIndiaIndonesiaIran, Islamic Rep.IraqIrelandIsle of ManIsraelItalyJamaicaJapanJordanKazakhstanKenyaKiribatiKorea, Dem. People’s Rep.Korea, Rep.KosovoKuwaitKyrgyz RepublicLao PDRLate-demographic dividendLatin America & Caribbean Latin America & Caribbean (excluding high income)Latin America & the Caribbean (IDA & IBRD countries)LatviaLeast developed countries: UN classificationLebanonLesothoLiberiaLibyaLiechtensteinLithuaniaLow & middle incomeLow incomeLower middle incomeLuxembourgMacao SAR, ChinaMacedonia, FYRMadagascarMalawiMalaysiaMaldivesMaliMaltaMarshall IslandsMauritaniaMauritiusMexicoMicronesia, Fed. Sts.Middle East & North AfricaMiddle East & North Africa (excluding high income)Middle East & North Africa (IDA & IBRD countries)Middle incomeMoldovaMonacoMongoliaMontenegroMoroccoMozambiqueMyanmarNamibiaNauruNepalNetherlandsNew CaledoniaNew ZealandNicaraguaNigerNigeriaNorth AmericaNorthern Mariana IslandsNorwayOECD membersOmanOther small statesPacific island small statesPakistanPalauPanamaPapua New GuineaParaguayPeruPhilippinesPolandPortugalPost-demographic dividendPre-demographic dividendPuerto RicoQatarRomaniaRussian FederationRwandaSamoaSan MarinoSao Tome and PrincipeSaudi ArabiaSenegalSerbiaSeychellesSierra LeoneSingaporeSint Maarten (Dutch part)Slovak RepublicSloveniaSmall statesSolomon IslandsSomaliaSouth AfricaSouth AsiaSouth Asia (IDA & IBRD)South SudanSpainSri LankaSt. Kitts and NevisSt. LuciaSt. Martin (French part)St. Vincent and the GrenadinesSub-Saharan Africa Sub-Saharan Africa (excluding high income)Sub-Saharan Africa (IDA & IBRD countries)SudanSurinameSwazilandSwedenSwitzerlandSyrian Arab RepublicTajikistanTanzaniaThailandTimor-LesteTogoTongaTrinidad and TobagoTunisiaTurkeyTurkmenistanTurks and Caicos IslandsTuvaluUgandaUkraineUnited Arab EmiratesUnited KingdomUnited StatesUpper middle incomeUruguayUzbekistanVanuatuVenezuela, RBVietnamVirgin Islands (U.S.)West Bank and GazaWorldYemen, Rep.ZambiaZimbabwe Timeline:
This timeline shows a graph from 1971 to 2009 of Singapore. No data until 1970. Number of actual observations by date: 39.
Source name:
World Development Indicators
Source organization:
European Commission, Joint Research Centre (JRC)/Netherlands Environmental Assessment Agency (PBL). Emission Database for Global Atmospheric Research (EDGAR): http://edgar.jrc.ec.europa.eu/
Categories, topics:
Energy & Mining, Environment
Last updated:
apr 23, 2017
Indicators value changes by year
Minimum:
234.666
jan 1, 1972
Maximum:
1.386K
jan 1, 2008
At the date of observation
Value
Absolute change
Change from previous value
jan 1, 1971
234.87
+234.87
0.0%
jan 1, 1972
234.666
-0.205
-0.09%
jan 1, 1973
259.306
+24.64
10.5%
jan 1, 1974
275.632
+16.326
6.3%
jan 1, 1975
284.364
+8.732
3.17%
jan 1, 1976
267.018
-17.346
-6.1%
jan 1, 1977
286.537
+19.519
7.31%
jan 1, 1978
313.653
+27.116
9.46%
jan 1, 1979
318.731
+5.078
1.62%
jan 1, 1980
322.301
+3.57
1.12%
jan 1, 1981
344.321
+22.02
6.83%
jan 1, 1982
376.657
+32.336
9.39%
jan 1, 1983
377.74
+1.083
0.29%
jan 1, 1984
374.012
-3.728
-0.99%
jan 1, 1985
353.007
-21.005
-5.62%
jan 1, 1986
321.767
-31.24
-8.85%
jan 1, 1987
334.845
+13.078
4.06%
jan 1, 1988
329.827
-5.019
-1.5%
jan 1, 1989
329.851
+0.024
0.01%
jan 1, 1990
336.732
+6.881
2.09%
jan 1, 1991
400.894
+64.162
19.05%
jan 1, 1992
516.746
+115.852
28.9%
jan 1, 1993
612.414
+95.669
18.51%
jan 1, 1994
733.565
+121.151
19.78%
jan 1, 1995
832.864
+99.298
13.54%
jan 1, 1996
865.532
+32.669
3.92%
jan 1, 1997
897.837
+32.304
3.73%
jan 1, 1998
876.972
-20.865
-2.32%
jan 1, 1999
835.553
-41.419
-4.72%
jan 1, 2000
815.979
-19.574
-2.34%
jan 1, 2001
887.451
+71.472
8.76%
jan 1, 2002
1.063K
+175.164
19.74%
jan 1, 2003
1.316K
+252.887
23.8%
jan 1, 2004
1.316K
+0.336
0.03%
jan 1, 2005
1.342K
+25.841
1.96%
jan 1, 2006
1.381K
+39.175
2.92%
jan 1, 2007
1.374K
-6.611
-0.48%
jan 1, 2008
1.386K
+11.603
0.84%
jan 1, 2009
1.385K
-0.926
-0.07%
Ranking of countries by current statistics by years


Comments: