29
/
en
AIzaSyAYiBZKx7MnpbEhh9jyipgxe19OcubqV5w
April 1, 2024
219854
Papua New Guinea
PNG
true
2
1
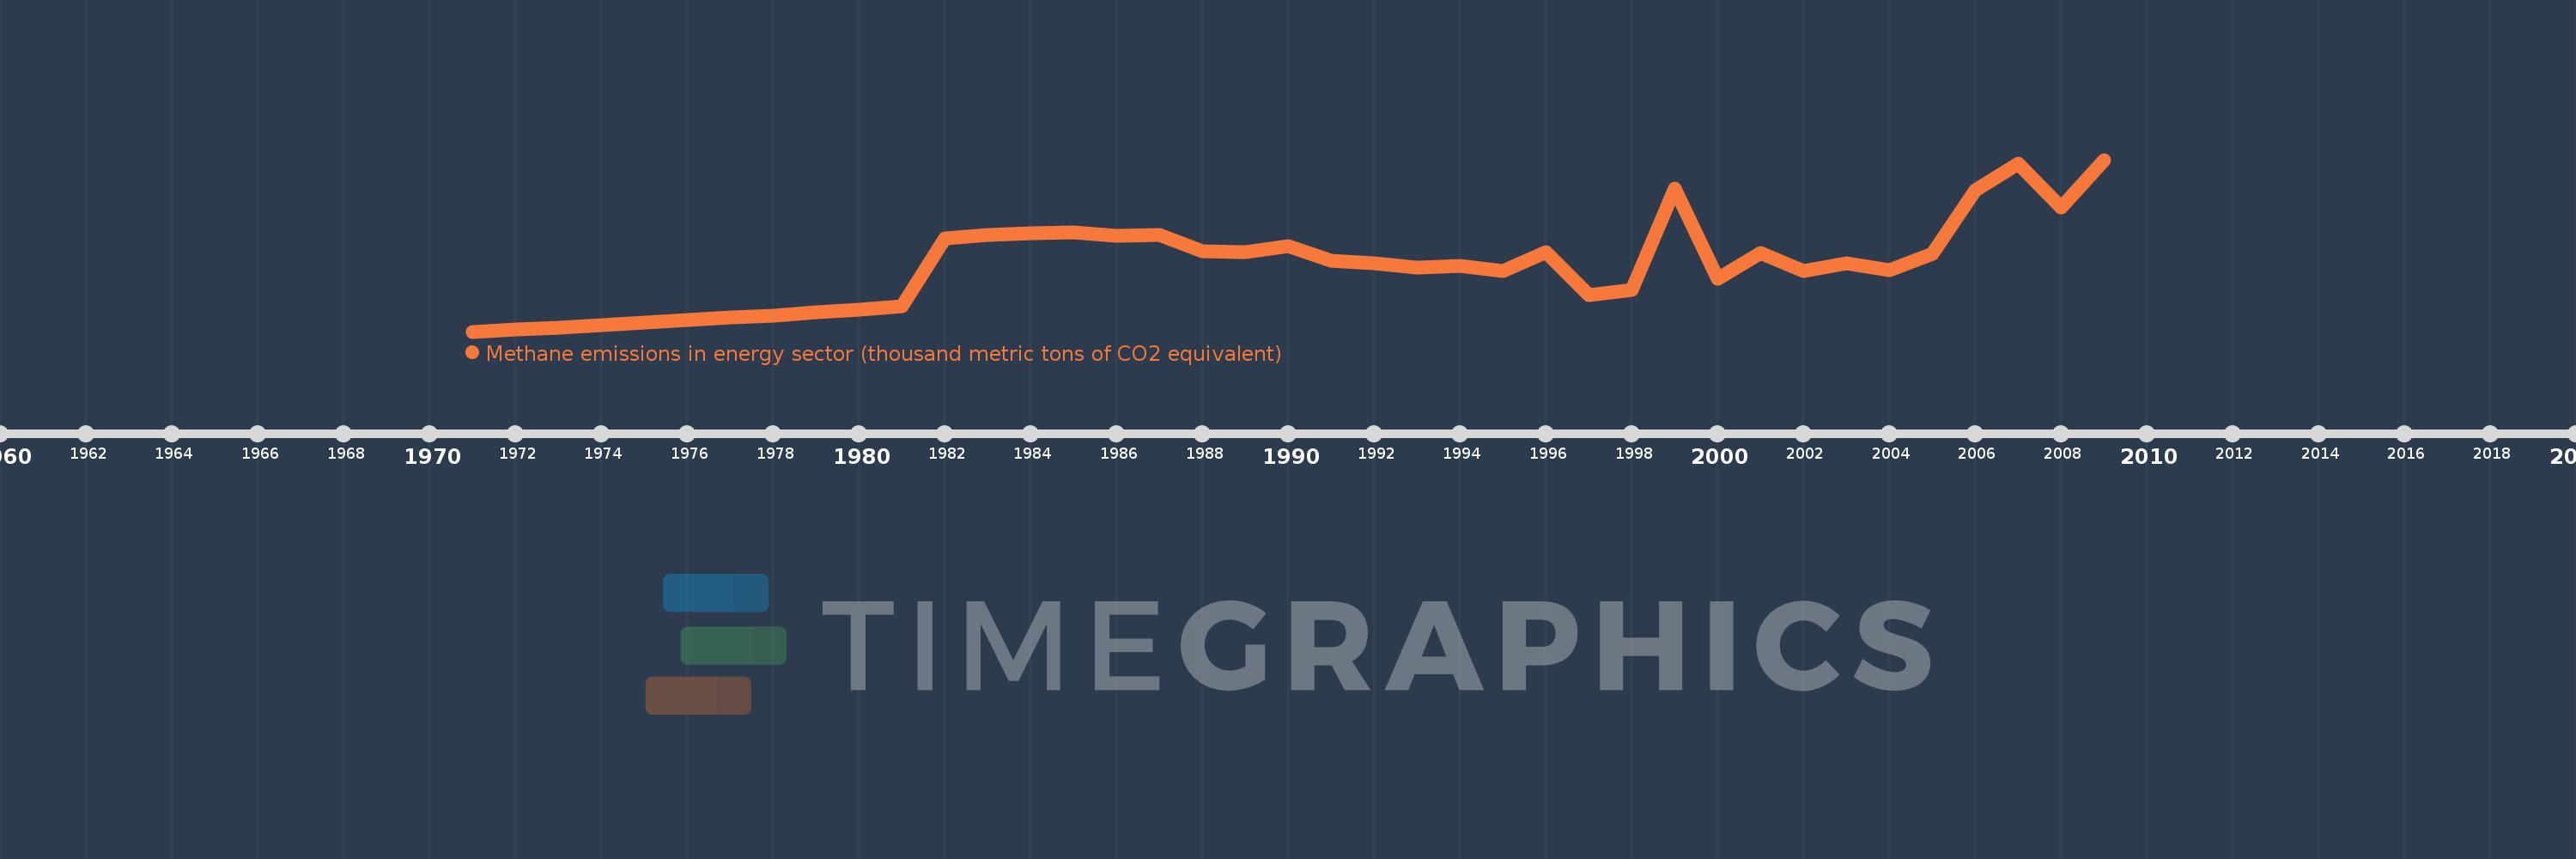
Methane emissions in energy sector (thousand metric tons of CO2 equivalent)
2009,2008,2007,2006,2005,2004,2003,2002,2001,2000,1999,1998,1997,1996,1995,1994,1993,1992,1991,1990,1989,1988,1987,1986,1985,1984,1983,1982,1981,1980,1979,1978,1977,1976,1975,1974,1973,1972,1971
This statistics in other country:
AfghanistanAlbaniaAlgeriaAmerican SamoaAndorraAngolaAntigua and BarbudaArab WorldArgentinaArmeniaArubaAustraliaAustriaAzerbaijanBahamas, TheBahrainBangladeshBarbadosBelarusBelgiumBelizeBeninBermudaBhutanBoliviaBosnia and HerzegovinaBotswanaBrazilBritish Virgin IslandsBrunei DarussalamBulgariaBurkina FasoBurundiCabo VerdeCambodiaCameroonCanadaCaribbean small statesCayman IslandsCentral African RepublicCentral Europe and the BalticsChadChannel IslandsChileChinaColombiaComorosCongo, Dem. Rep.Congo, Rep.Costa RicaCote d'IvoireCroatiaCubaCuracaoCyprusCzech RepublicDenmarkDjiboutiDominicaDominican RepublicEarly-demographic dividendEast Asia & PacificEast Asia & Pacific (excluding high income)East Asia & Pacific (IDA & IBRD countries)EcuadorEgypt, Arab Rep.El SalvadorEquatorial GuineaEritreaEstoniaEthiopiaEuro areaEurope & Central AsiaEurope & Central Asia (excluding high income)Europe & Central Asia (IDA & IBRD countries)European UnionFaroe IslandsFijiFinlandFragile and conflict affected situationsFranceFrench PolynesiaGabonGambia, TheGeorgiaGermanyGhanaGibraltarGreeceGreenlandGrenadaGuamGuatemalaGuineaGuinea-BissauGuyanaHaitiHeavily indebted poor countries (HIPC)High incomeHondurasHong Kong SAR, ChinaHungaryIBRD onlyIcelandIDA & IBRD totalIDA blendIDA onlyIDA totalIndiaIndonesiaIran, Islamic Rep.IraqIrelandIsle of ManIsraelItalyJamaicaJapanJordanKazakhstanKenyaKiribatiKorea, Dem. People’s Rep.Korea, Rep.KosovoKuwaitKyrgyz RepublicLao PDRLate-demographic dividendLatin America & Caribbean Latin America & Caribbean (excluding high income)Latin America & the Caribbean (IDA & IBRD countries)LatviaLeast developed countries: UN classificationLebanonLesothoLiberiaLibyaLiechtensteinLithuaniaLow & middle incomeLow incomeLower middle incomeLuxembourgMacao SAR, ChinaMacedonia, FYRMadagascarMalawiMalaysiaMaldivesMaliMaltaMarshall IslandsMauritaniaMauritiusMexicoMicronesia, Fed. Sts.Middle East & North AfricaMiddle East & North Africa (excluding high income)Middle East & North Africa (IDA & IBRD countries)Middle incomeMoldovaMonacoMongoliaMontenegroMoroccoMozambiqueMyanmarNamibiaNauruNepalNetherlandsNew CaledoniaNew ZealandNicaraguaNigerNigeriaNorth AmericaNorthern Mariana IslandsNorwayOECD membersOmanOther small statesPacific island small statesPakistanPalauPanamaPapua New GuineaParaguayPeruPhilippinesPolandPortugalPost-demographic dividendPre-demographic dividendPuerto RicoQatarRomaniaRussian FederationRwandaSamoaSan MarinoSao Tome and PrincipeSaudi ArabiaSenegalSerbiaSeychellesSierra LeoneSingaporeSint Maarten (Dutch part)Slovak RepublicSloveniaSmall statesSolomon IslandsSomaliaSouth AfricaSouth AsiaSouth Asia (IDA & IBRD)South SudanSpainSri LankaSt. Kitts and NevisSt. LuciaSt. Martin (French part)St. Vincent and the GrenadinesSub-Saharan Africa Sub-Saharan Africa (excluding high income)Sub-Saharan Africa (IDA & IBRD countries)SudanSurinameSwazilandSwedenSwitzerlandSyrian Arab RepublicTajikistanTanzaniaThailandTimor-LesteTogoTongaTrinidad and TobagoTunisiaTurkeyTurkmenistanTurks and Caicos IslandsTuvaluUgandaUkraineUnited Arab EmiratesUnited KingdomUnited StatesUpper middle incomeUruguayUzbekistanVanuatuVenezuela, RBVietnamVirgin Islands (U.S.)West Bank and GazaWorldYemen, Rep.ZambiaZimbabwe Timeline:
This timeline shows a graph from 1971 to 2009 of Papua New Guinea. No data until 1970. Number of actual observations by date: 39.
Source name:
World Development Indicators
Source organization:
European Commission, Joint Research Centre (JRC)/Netherlands Environmental Assessment Agency (PBL). Emission Database for Global Atmospheric Research (EDGAR): http://edgar.jrc.ec.europa.eu/
Categories, topics:
Energy & Mining, Environment
Last updated:
apr 23, 2017
Indicators value changes by year
Minimum:
316.575
jan 1, 1971
Maximum:
909.58
jan 1, 2009
At the date of observation
Value
Absolute change
Change from previous value
jan 1, 1971
316.575
+316.575
0.0%
jan 1, 1972
323.93
+7.355
2.32%
jan 1, 1973
331.253
+7.323
2.26%
jan 1, 1974
339.647
+8.395
2.53%
jan 1, 1975
347.942
+8.295
2.44%
jan 1, 1976
356.163
+8.221
2.36%
jan 1, 1977
364.67
+8.507
2.39%
jan 1, 1978
372.519
+7.849
2.15%
jan 1, 1979
382.682
+10.163
2.73%
jan 1, 1980
392.521
+9.839
2.57%
jan 1, 1981
404.047
+11.526
2.94%
jan 1, 1982
636.849
+232.802
57.62%
jan 1, 1983
650.346
+13.497
2.12%
jan 1, 1984
654.99
+4.644
0.71%
jan 1, 1985
658.31
+3.32
0.51%
jan 1, 1986
646.019
-12.291
-1.87%
jan 1, 1987
650.623
+4.604
0.71%
jan 1, 1988
592.463
-58.16
-8.94%
jan 1, 1989
591.024
-1.438
-0.24%
jan 1, 1990
611.196
+20.172
3.41%
jan 1, 1991
561.129
-50.067
-8.19%
jan 1, 1992
552.117
-9.012
-1.61%
jan 1, 1993
537.246
-14.871
-2.69%
jan 1, 1994
542.195
+4.949
0.92%
jan 1, 1995
525.681
-16.515
-3.05%
jan 1, 1996
590.002
+64.322
12.24%
jan 1, 1997
443.321
-146.682
-24.86%
jan 1, 1998
460.451
+17.13
3.86%
jan 1, 1999
811.173
+350.722
76.17%
jan 1, 2000
497.591
-313.582
-38.66%
jan 1, 2001
588.566
+90.976
18.28%
jan 1, 2002
526.32
-62.246
-10.58%
jan 1, 2003
553.29
+26.97
5.12%
jan 1, 2004
527.576
-25.714
-4.65%
jan 1, 2005
583.956
+56.379
10.69%
jan 1, 2006
803.62
+219.664
37.62%
jan 1, 2007
895.634
+92.015
11.45%
jan 1, 2008
743.755
-151.88
-16.96%
jan 1, 2009
909.58
+165.826
22.3%
Ranking of countries by current statistics by years


Comments: