29
/
en
AIzaSyAYiBZKx7MnpbEhh9jyipgxe19OcubqV5w
April 1, 2024
48331
Middle East & North Africa
MEA
false
2
1
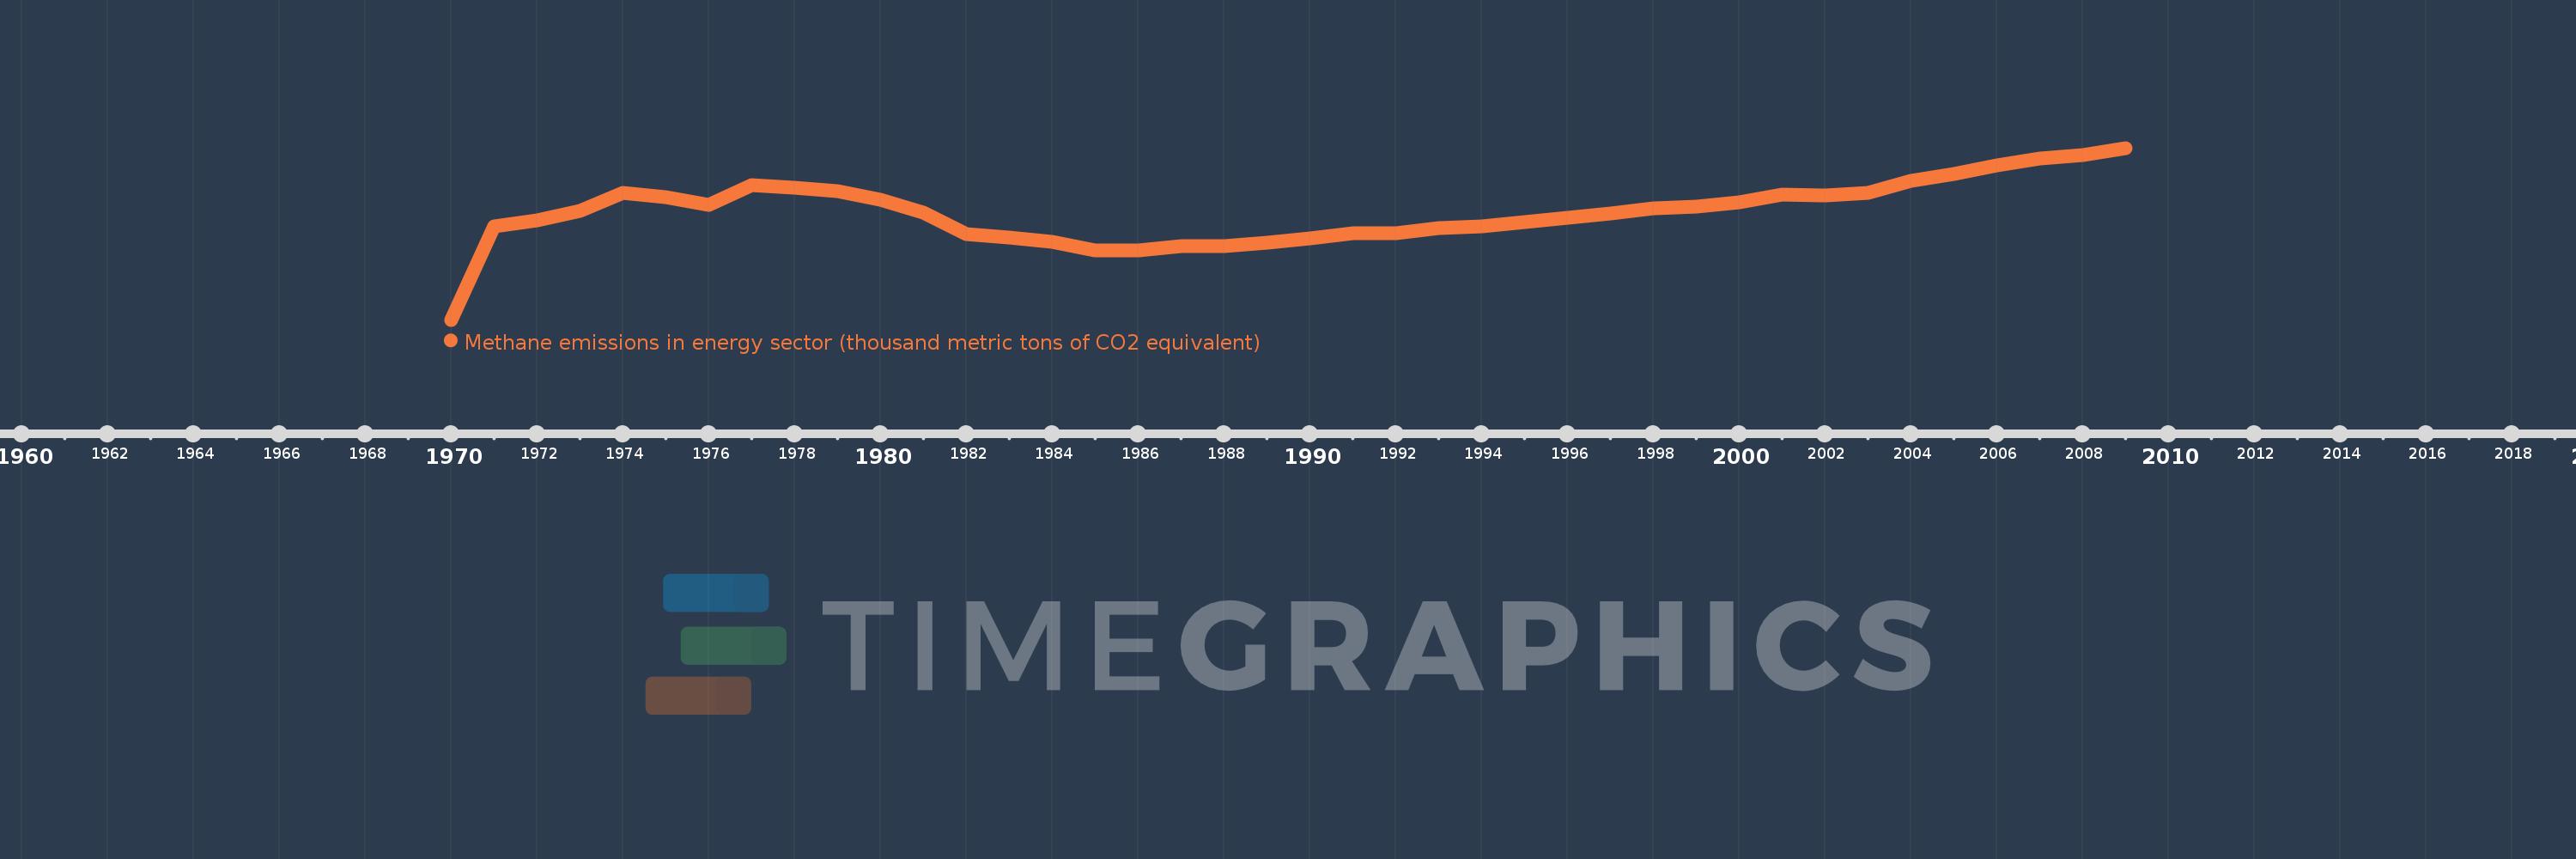
Methane emissions in energy sector (thousand metric tons of CO2 equivalent)
2009,2008,2007,2006,2005,2004,2003,2002,2001,2000,1999,1998,1997,1996,1995,1994,1993,1992,1991,1990,1989,1988,1987,1986,1985,1984,1983,1982,1981,1980,1979,1978,1977,1976,1975,1974,1973,1972,1971,1970
This statistics in other country:
AfghanistanAlbaniaAlgeriaAmerican SamoaAndorraAngolaAntigua and BarbudaArab WorldArgentinaArmeniaArubaAustraliaAustriaAzerbaijanBahamas, TheBahrainBangladeshBarbadosBelarusBelgiumBelizeBeninBermudaBhutanBoliviaBosnia and HerzegovinaBotswanaBrazilBritish Virgin IslandsBrunei DarussalamBulgariaBurkina FasoBurundiCabo VerdeCambodiaCameroonCanadaCaribbean small statesCayman IslandsCentral African RepublicCentral Europe and the BalticsChadChannel IslandsChileChinaColombiaComorosCongo, Dem. Rep.Congo, Rep.Costa RicaCote d'IvoireCroatiaCubaCuracaoCyprusCzech RepublicDenmarkDjiboutiDominicaDominican RepublicEarly-demographic dividendEast Asia & PacificEast Asia & Pacific (excluding high income)East Asia & Pacific (IDA & IBRD countries)EcuadorEgypt, Arab Rep.El SalvadorEquatorial GuineaEritreaEstoniaEthiopiaEuro areaEurope & Central AsiaEurope & Central Asia (excluding high income)Europe & Central Asia (IDA & IBRD countries)European UnionFaroe IslandsFijiFinlandFragile and conflict affected situationsFranceFrench PolynesiaGabonGambia, TheGeorgiaGermanyGhanaGibraltarGreeceGreenlandGrenadaGuamGuatemalaGuineaGuinea-BissauGuyanaHaitiHeavily indebted poor countries (HIPC)High incomeHondurasHong Kong SAR, ChinaHungaryIBRD onlyIcelandIDA & IBRD totalIDA blendIDA onlyIDA totalIndiaIndonesiaIran, Islamic Rep.IraqIrelandIsle of ManIsraelItalyJamaicaJapanJordanKazakhstanKenyaKiribatiKorea, Dem. People’s Rep.Korea, Rep.KosovoKuwaitKyrgyz RepublicLao PDRLate-demographic dividendLatin America & Caribbean Latin America & Caribbean (excluding high income)Latin America & the Caribbean (IDA & IBRD countries)LatviaLeast developed countries: UN classificationLebanonLesothoLiberiaLibyaLiechtensteinLithuaniaLow & middle incomeLow incomeLower middle incomeLuxembourgMacao SAR, ChinaMacedonia, FYRMadagascarMalawiMalaysiaMaldivesMaliMaltaMarshall IslandsMauritaniaMauritiusMexicoMicronesia, Fed. Sts.Middle East & North AfricaMiddle East & North Africa (excluding high income)Middle East & North Africa (IDA & IBRD countries)Middle incomeMoldovaMonacoMongoliaMontenegroMoroccoMozambiqueMyanmarNamibiaNauruNepalNetherlandsNew CaledoniaNew ZealandNicaraguaNigerNigeriaNorth AmericaNorthern Mariana IslandsNorwayOECD membersOmanOther small statesPacific island small statesPakistanPalauPanamaPapua New GuineaParaguayPeruPhilippinesPolandPortugalPost-demographic dividendPre-demographic dividendPuerto RicoQatarRomaniaRussian FederationRwandaSamoaSan MarinoSao Tome and PrincipeSaudi ArabiaSenegalSerbiaSeychellesSierra LeoneSingaporeSint Maarten (Dutch part)Slovak RepublicSloveniaSmall statesSolomon IslandsSomaliaSouth AfricaSouth AsiaSouth Asia (IDA & IBRD)South SudanSpainSri LankaSt. Kitts and NevisSt. LuciaSt. Martin (French part)St. Vincent and the GrenadinesSub-Saharan Africa Sub-Saharan Africa (excluding high income)Sub-Saharan Africa (IDA & IBRD countries)SudanSurinameSwazilandSwedenSwitzerlandSyrian Arab RepublicTajikistanTanzaniaThailandTimor-LesteTogoTongaTrinidad and TobagoTunisiaTurkeyTurkmenistanTurks and Caicos IslandsTuvaluUgandaUkraineUnited Arab EmiratesUnited KingdomUnited StatesUpper middle incomeUruguayUzbekistanVanuatuVenezuela, RBVietnamVirgin Islands (U.S.)West Bank and GazaWorldYemen, Rep.ZambiaZimbabwe Timeline:
This timeline shows a graph from 1970 to 2009 of Middle East & North Africa. No data until 1969. Number of actual observations by date: 40.
Source name:
World Development Indicators
Source organization:
European Commission, Joint Research Centre (JRC)/Netherlands Environmental Assessment Agency (PBL). Emission Database for Global Atmospheric Research (EDGAR): http://edgar.jrc.ec.europa.eu/
Categories, topics:
Energy & Mining, Environment
Last updated:
apr 23, 2017
Indicators value changes by year
Maximum:
317.266K
jan 1, 2009
At the date of observation
Value
Absolute change
Change from previous value
jan 1, 1971
171.682K
+171.682K
%
jan 1, 1972
183.298K
+11.615K
6.77%
jan 1, 1973
201.642K
+18.345K
10.01%
jan 1, 1974
234.673K
+33.031K
16.38%
jan 1, 1975
226.665K
-8.008K
-3.41%
jan 1, 1976
212.718K
-13.947K
-6.15%
jan 1, 1977
248.451K
+35.733K
16.8%
jan 1, 1978
243.209K
-5.242K
-2.11%
jan 1, 1979
237.886K
-5.323K
-2.19%
jan 1, 1980
221.522K
-16.364K
-6.88%
jan 1, 1981
198.46K
-23.062K
-10.41%
jan 1, 1982
157.932K
-40.527K
-20.42%
jan 1, 1983
151.849K
-6.084K
-3.85%
jan 1, 1984
143.101K
-8.748K
-5.76%
jan 1, 1985
128.059K
-15.042K
-10.51%
jan 1, 1986
127.44K
-619.333
-0.48%
jan 1, 1987
135.539K
+8.1K
6.36%
jan 1, 1988
136.223K
+683.713
0.5%
jan 1, 1989
143.007K
+6.783K
4.98%
jan 1, 1990
150.152K
+7.146K
5.0%
jan 1, 1991
159.829K
+9.677K
6.44%
jan 1, 1992
159.052K
-776.966
-0.49%
jan 1, 1993
169.067K
+10.015K
6.3%
jan 1, 1994
173.067K
+4.0K
2.37%
jan 1, 1995
180.978K
+7.911K
4.57%
jan 1, 1996
188.316K
+7.338K
4.05%
jan 1, 1997
195.656K
+7.34K
3.9%
jan 1, 1998
205.338K
+9.682K
4.95%
jan 1, 1999
209.151K
+3.813K
1.86%
jan 1, 2000
216.369K
+7.218K
3.45%
jan 1, 2001
231.244K
+14.876K
6.88%
jan 1, 2002
228.886K
-2.359K
-1.02%
jan 1, 2003
234.093K
+5.208K
2.28%
jan 1, 2004
256.076K
+21.983K
9.39%
jan 1, 2005
268.848K
+12.772K
4.99%
jan 1, 2006
284.905K
+16.057K
5.97%
jan 1, 2007
298.396K
+13.491K
4.74%
jan 1, 2008
304.057K
+5.661K
1.9%
jan 1, 2009
317.266K
+13.208K
4.34%
Ranking of countries by current statistics by years


Comments: