29
/
en
AIzaSyAYiBZKx7MnpbEhh9jyipgxe19OcubqV5w
April 1, 2024
144684
Guatemala
GTM
true
2
1
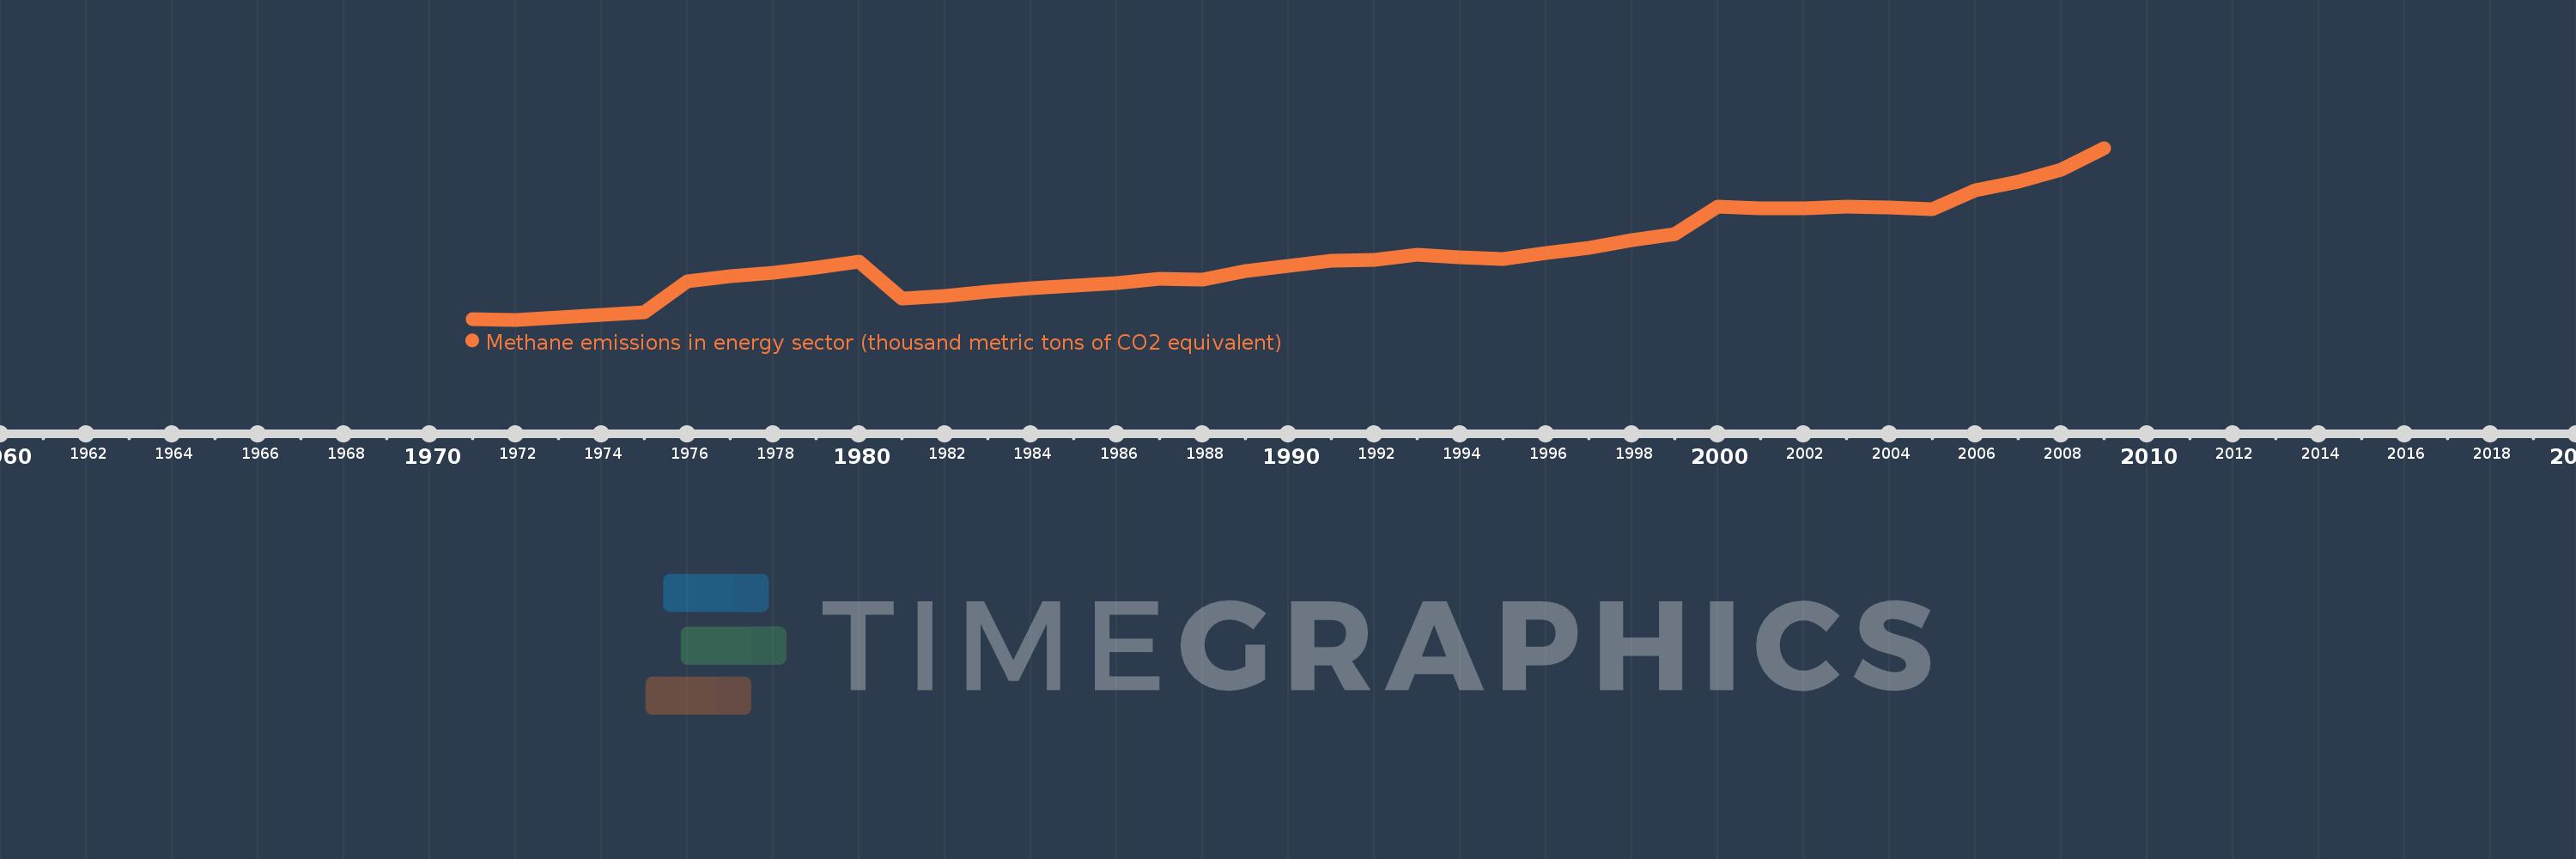
Methane emissions in energy sector (thousand metric tons of CO2 equivalent)
2009,2008,2007,2006,2005,2004,2003,2002,2001,2000,1999,1998,1997,1996,1995,1994,1993,1992,1991,1990,1989,1988,1987,1986,1985,1984,1983,1982,1981,1980,1979,1978,1977,1976,1975,1974,1973,1972,1971
This statistics in other country:
AfghanistanAlbaniaAlgeriaAmerican SamoaAndorraAngolaAntigua and BarbudaArab WorldArgentinaArmeniaArubaAustraliaAustriaAzerbaijanBahamas, TheBahrainBangladeshBarbadosBelarusBelgiumBelizeBeninBermudaBhutanBoliviaBosnia and HerzegovinaBotswanaBrazilBritish Virgin IslandsBrunei DarussalamBulgariaBurkina FasoBurundiCabo VerdeCambodiaCameroonCanadaCaribbean small statesCayman IslandsCentral African RepublicCentral Europe and the BalticsChadChannel IslandsChileChinaColombiaComorosCongo, Dem. Rep.Congo, Rep.Costa RicaCote d'IvoireCroatiaCubaCuracaoCyprusCzech RepublicDenmarkDjiboutiDominicaDominican RepublicEarly-demographic dividendEast Asia & PacificEast Asia & Pacific (excluding high income)East Asia & Pacific (IDA & IBRD countries)EcuadorEgypt, Arab Rep.El SalvadorEquatorial GuineaEritreaEstoniaEthiopiaEuro areaEurope & Central AsiaEurope & Central Asia (excluding high income)Europe & Central Asia (IDA & IBRD countries)European UnionFaroe IslandsFijiFinlandFragile and conflict affected situationsFranceFrench PolynesiaGabonGambia, TheGeorgiaGermanyGhanaGibraltarGreeceGreenlandGrenadaGuamGuatemalaGuineaGuinea-BissauGuyanaHaitiHeavily indebted poor countries (HIPC)High incomeHondurasHong Kong SAR, ChinaHungaryIBRD onlyIcelandIDA & IBRD totalIDA blendIDA onlyIDA totalIndiaIndonesiaIran, Islamic Rep.IraqIrelandIsle of ManIsraelItalyJamaicaJapanJordanKazakhstanKenyaKiribatiKorea, Dem. People’s Rep.Korea, Rep.KosovoKuwaitKyrgyz RepublicLao PDRLate-demographic dividendLatin America & Caribbean Latin America & Caribbean (excluding high income)Latin America & the Caribbean (IDA & IBRD countries)LatviaLeast developed countries: UN classificationLebanonLesothoLiberiaLibyaLiechtensteinLithuaniaLow & middle incomeLow incomeLower middle incomeLuxembourgMacao SAR, ChinaMacedonia, FYRMadagascarMalawiMalaysiaMaldivesMaliMaltaMarshall IslandsMauritaniaMauritiusMexicoMicronesia, Fed. Sts.Middle East & North AfricaMiddle East & North Africa (excluding high income)Middle East & North Africa (IDA & IBRD countries)Middle incomeMoldovaMonacoMongoliaMontenegroMoroccoMozambiqueMyanmarNamibiaNauruNepalNetherlandsNew CaledoniaNew ZealandNicaraguaNigerNigeriaNorth AmericaNorthern Mariana IslandsNorwayOECD membersOmanOther small statesPacific island small statesPakistanPalauPanamaPapua New GuineaParaguayPeruPhilippinesPolandPortugalPost-demographic dividendPre-demographic dividendPuerto RicoQatarRomaniaRussian FederationRwandaSamoaSan MarinoSao Tome and PrincipeSaudi ArabiaSenegalSerbiaSeychellesSierra LeoneSingaporeSint Maarten (Dutch part)Slovak RepublicSloveniaSmall statesSolomon IslandsSomaliaSouth AfricaSouth AsiaSouth Asia (IDA & IBRD)South SudanSpainSri LankaSt. Kitts and NevisSt. LuciaSt. Martin (French part)St. Vincent and the GrenadinesSub-Saharan Africa Sub-Saharan Africa (excluding high income)Sub-Saharan Africa (IDA & IBRD countries)SudanSurinameSwazilandSwedenSwitzerlandSyrian Arab RepublicTajikistanTanzaniaThailandTimor-LesteTogoTongaTrinidad and TobagoTunisiaTurkeyTurkmenistanTurks and Caicos IslandsTuvaluUgandaUkraineUnited Arab EmiratesUnited KingdomUnited StatesUpper middle incomeUruguayUzbekistanVanuatuVenezuela, RBVietnamVirgin Islands (U.S.)West Bank and GazaWorldYemen, Rep.ZambiaZimbabwe Timeline:
This timeline shows a graph from 1971 to 2009 of Guatemala. No data until 1970. Number of actual observations by date: 39.
Source name:
World Development Indicators
Source organization:
European Commission, Joint Research Centre (JRC)/Netherlands Environmental Assessment Agency (PBL). Emission Database for Global Atmospheric Research (EDGAR): http://edgar.jrc.ec.europa.eu/
Categories, topics:
Energy & Mining, Environment
Last updated:
apr 23, 2017
Indicators value changes by year
Minimum:
530.058
jan 1, 1972
Maximum:
1.235K
jan 1, 2009
At the date of observation
Value
Absolute change
Change from previous value
jan 1, 1971
531.247
+531.247
0.0%
jan 1, 1972
530.058
-1.19
-0.22%
jan 1, 1973
540.127
+10.07
1.9%
jan 1, 1974
550.876
+10.749
1.99%
jan 1, 1975
560.977
+10.101
1.83%
jan 1, 1976
687.089
+126.113
22.48%
jan 1, 1977
707.359
+20.27
2.95%
jan 1, 1978
723.549
+16.191
2.29%
jan 1, 1979
745.086
+21.537
2.98%
jan 1, 1980
767.491
+22.404
3.01%
jan 1, 1981
615.629
-151.861
-19.79%
jan 1, 1982
627.492
+11.863
1.93%
jan 1, 1983
646.515
+19.023
3.03%
jan 1, 1984
659.961
+13.446
2.08%
jan 1, 1985
668.463
+8.502
1.29%
jan 1, 1986
679.556
+11.093
1.66%
jan 1, 1987
699.655
+20.099
2.96%
jan 1, 1988
696.25
-3.405
-0.49%
jan 1, 1989
731.547
+35.297
5.07%
jan 1, 1990
749.615
+18.068
2.47%
jan 1, 1991
770.69
+21.075
2.81%
jan 1, 1992
774.945
+4.255
0.55%
jan 1, 1993
797.92
+22.975
2.96%
jan 1, 1994
787.881
-10.039
-1.26%
jan 1, 1995
778.749
-9.132
-1.16%
jan 1, 1996
803.129
+24.38
3.13%
jan 1, 1997
826.812
+23.683
2.95%
jan 1, 1998
855.582
+28.77
3.48%
jan 1, 1999
881.253
+25.671
3.0%
jan 1, 2000
993.617
+112.363
12.75%
jan 1, 2001
987.187
-6.43
-0.65%
jan 1, 2002
987.994
+0.807
0.08%
jan 1, 2003
995.007
+7.013
0.71%
jan 1, 2004
990.715
-4.292
-0.43%
jan 1, 2005
985.328
-5.386
-0.54%
jan 1, 2006
1.061K
+75.456
7.66%
jan 1, 2007
1.097K
+36.166
3.41%
jan 1, 2008
1.145K
+48.08
4.38%
jan 1, 2009
1.235K
+89.993
7.86%
Ranking of countries by current statistics by years


Comments: