29
/
en
AIzaSyAYiBZKx7MnpbEhh9jyipgxe19OcubqV5w
April 1, 2024
276912
United States
USA
true
2
1
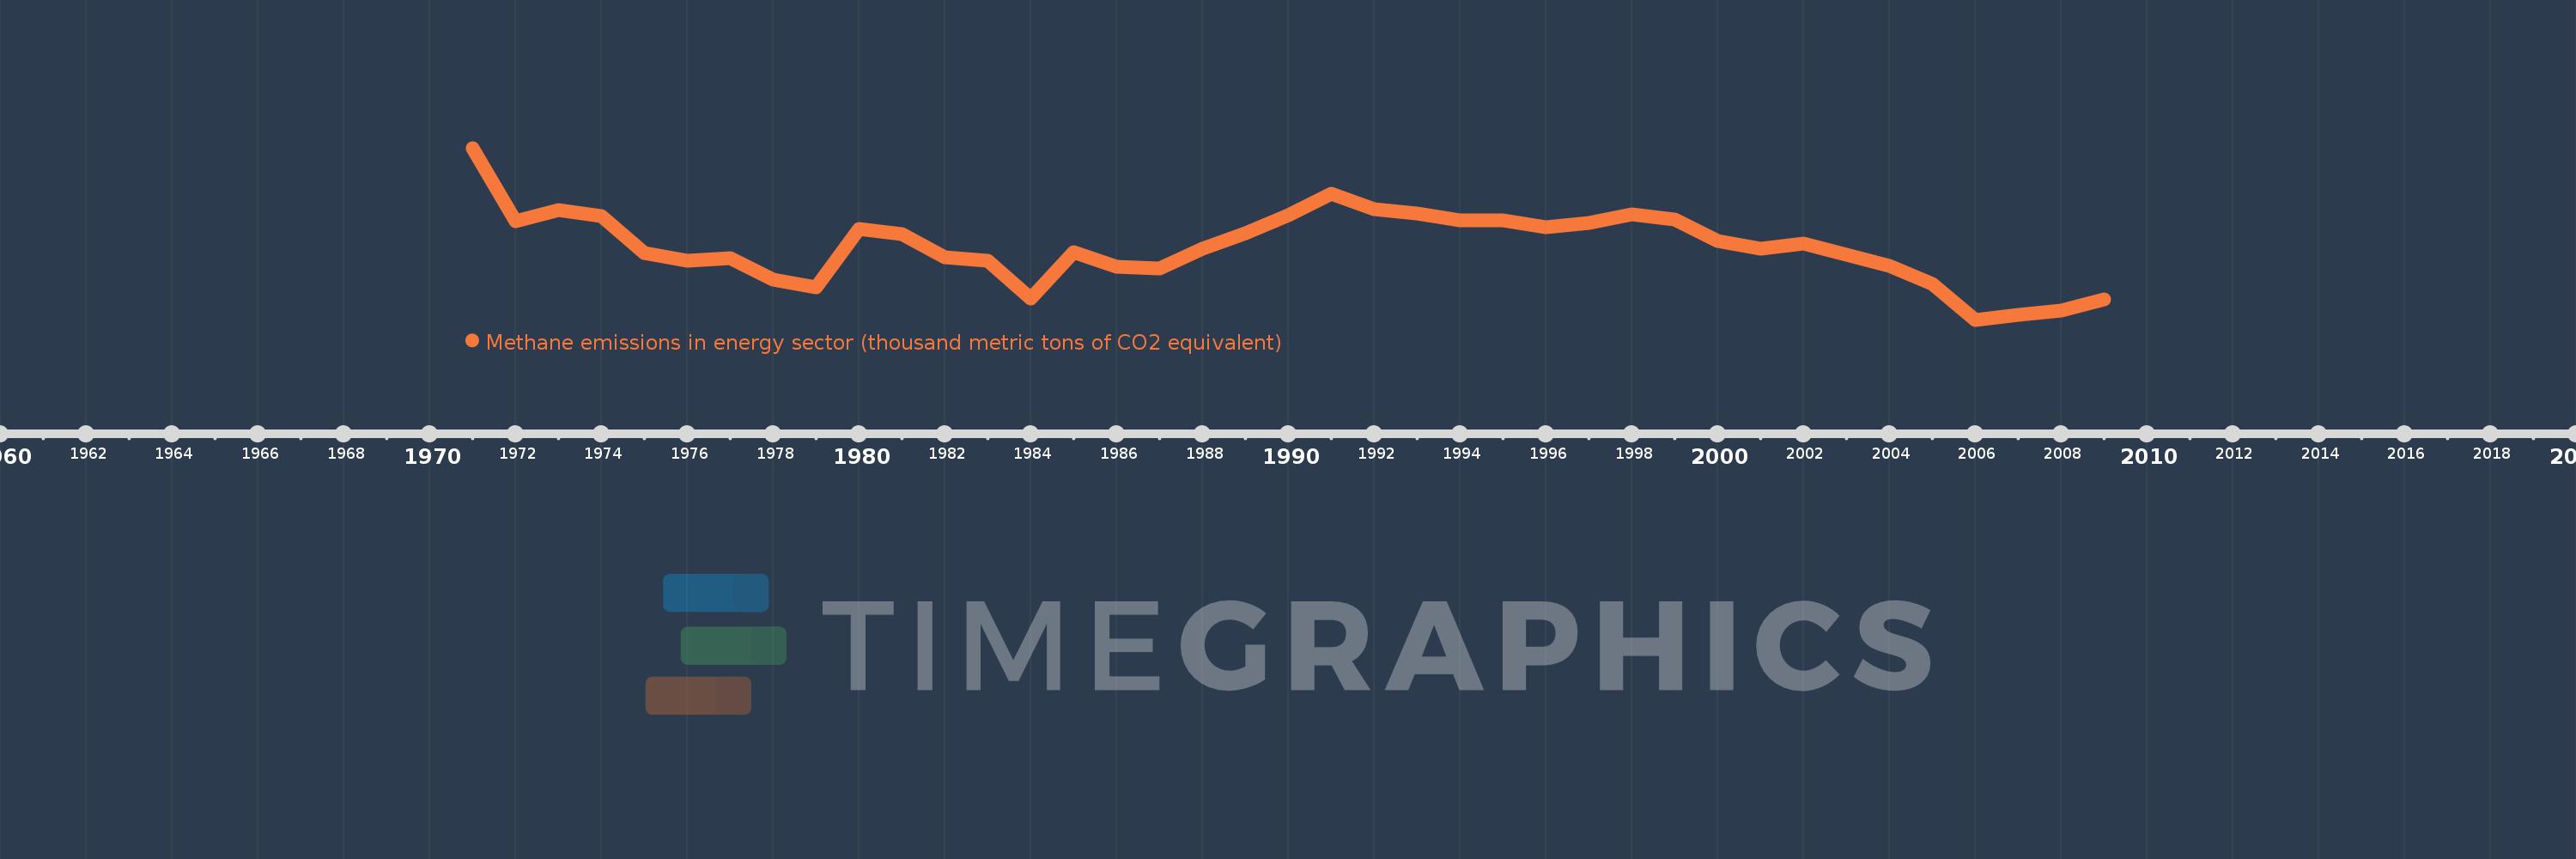
Methane emissions in energy sector (thousand metric tons of CO2 equivalent)
2009,2008,2007,2006,2005,2004,2003,2002,2001,2000,1999,1998,1997,1996,1995,1994,1993,1992,1991,1990,1989,1988,1987,1986,1985,1984,1983,1982,1981,1980,1979,1978,1977,1976,1975,1974,1973,1972,1971
This statistics in other country:
AfghanistanAlbaniaAlgeriaAmerican SamoaAndorraAngolaAntigua and BarbudaArab WorldArgentinaArmeniaArubaAustraliaAustriaAzerbaijanBahamas, TheBahrainBangladeshBarbadosBelarusBelgiumBelizeBeninBermudaBhutanBoliviaBosnia and HerzegovinaBotswanaBrazilBritish Virgin IslandsBrunei DarussalamBulgariaBurkina FasoBurundiCabo VerdeCambodiaCameroonCanadaCaribbean small statesCayman IslandsCentral African RepublicCentral Europe and the BalticsChadChannel IslandsChileChinaColombiaComorosCongo, Dem. Rep.Congo, Rep.Costa RicaCote d'IvoireCroatiaCubaCuracaoCyprusCzech RepublicDenmarkDjiboutiDominicaDominican RepublicEarly-demographic dividendEast Asia & PacificEast Asia & Pacific (excluding high income)East Asia & Pacific (IDA & IBRD countries)EcuadorEgypt, Arab Rep.El SalvadorEquatorial GuineaEritreaEstoniaEthiopiaEuro areaEurope & Central AsiaEurope & Central Asia (excluding high income)Europe & Central Asia (IDA & IBRD countries)European UnionFaroe IslandsFijiFinlandFragile and conflict affected situationsFranceFrench PolynesiaGabonGambia, TheGeorgiaGermanyGhanaGibraltarGreeceGreenlandGrenadaGuamGuatemalaGuineaGuinea-BissauGuyanaHaitiHeavily indebted poor countries (HIPC)High incomeHondurasHong Kong SAR, ChinaHungaryIBRD onlyIcelandIDA & IBRD totalIDA blendIDA onlyIDA totalIndiaIndonesiaIran, Islamic Rep.IraqIrelandIsle of ManIsraelItalyJamaicaJapanJordanKazakhstanKenyaKiribatiKorea, Dem. People’s Rep.Korea, Rep.KosovoKuwaitKyrgyz RepublicLao PDRLate-demographic dividendLatin America & Caribbean Latin America & Caribbean (excluding high income)Latin America & the Caribbean (IDA & IBRD countries)LatviaLeast developed countries: UN classificationLebanonLesothoLiberiaLibyaLiechtensteinLithuaniaLow & middle incomeLow incomeLower middle incomeLuxembourgMacao SAR, ChinaMacedonia, FYRMadagascarMalawiMalaysiaMaldivesMaliMaltaMarshall IslandsMauritaniaMauritiusMexicoMicronesia, Fed. Sts.Middle East & North AfricaMiddle East & North Africa (excluding high income)Middle East & North Africa (IDA & IBRD countries)Middle incomeMoldovaMonacoMongoliaMontenegroMoroccoMozambiqueMyanmarNamibiaNauruNepalNetherlandsNew CaledoniaNew ZealandNicaraguaNigerNigeriaNorth AmericaNorthern Mariana IslandsNorwayOECD membersOmanOther small statesPacific island small statesPakistanPalauPanamaPapua New GuineaParaguayPeruPhilippinesPolandPortugalPost-demographic dividendPre-demographic dividendPuerto RicoQatarRomaniaRussian FederationRwandaSamoaSan MarinoSao Tome and PrincipeSaudi ArabiaSenegalSerbiaSeychellesSierra LeoneSingaporeSint Maarten (Dutch part)Slovak RepublicSloveniaSmall statesSolomon IslandsSomaliaSouth AfricaSouth AsiaSouth Asia (IDA & IBRD)South SudanSpainSri LankaSt. Kitts and NevisSt. LuciaSt. Martin (French part)St. Vincent and the GrenadinesSub-Saharan Africa Sub-Saharan Africa (excluding high income)Sub-Saharan Africa (IDA & IBRD countries)SudanSurinameSwazilandSwedenSwitzerlandSyrian Arab RepublicTajikistanTanzaniaThailandTimor-LesteTogoTongaTrinidad and TobagoTunisiaTurkeyTurkmenistanTurks and Caicos IslandsTuvaluUgandaUkraineUnited Arab EmiratesUnited KingdomUnited StatesUpper middle incomeUruguayUzbekistanVanuatuVenezuela, RBVietnamVirgin Islands (U.S.)West Bank and GazaWorldYemen, Rep.ZambiaZimbabwe Timeline:
This timeline shows a graph from 1971 to 2009 of United States. No data until 1970. Number of actual observations by date: 39.
Source name:
World Development Indicators
Source organization:
European Commission, Joint Research Centre (JRC)/Netherlands Environmental Assessment Agency (PBL). Emission Database for Global Atmospheric Research (EDGAR): http://edgar.jrc.ec.europa.eu/
Categories, topics:
Energy & Mining, Environment
Last updated:
apr 23, 2017
Indicators value changes by year
Minimum:
213.075K
jan 1, 2006
Maximum:
266.716K
jan 1, 1971
At the date of observation
Value
Absolute change
Change from previous value
jan 1, 1971
266.716K
+266.716K
0.0%
jan 1, 1972
243.871K
-22.845K
-8.57%
jan 1, 1973
247.196K
+3.326K
1.36%
jan 1, 1974
245.506K
-1.69K
-0.68%
jan 1, 1975
233.911K
-11.595K
-4.72%
jan 1, 1976
231.417K
-2.493K
-1.07%
jan 1, 1977
232.265K
+847.522
0.37%
jan 1, 1978
225.616K
-6.649K
-2.86%
jan 1, 1979
223.156K
-2.46K
-1.09%
jan 1, 1980
241.407K
+18.251K
8.18%
jan 1, 1981
239.907K
-1.5K
-0.62%
jan 1, 1982
232.651K
-7.256K
-3.02%
jan 1, 1983
231.416K
-1.235K
-0.53%
jan 1, 1984
219.808K
-11.609K
-5.02%
jan 1, 1985
234.132K
+14.325K
6.52%
jan 1, 1986
229.622K
-4.511K
-1.93%
jan 1, 1987
229.016K
-605.781
-0.26%
jan 1, 1988
235.327K
+6.311K
2.76%
jan 1, 1989
240.149K
+4.823K
2.05%
jan 1, 1990
245.754K
+5.605K
2.33%
jan 1, 1991
252.382K
+6.627K
2.7%
jan 1, 1992
247.547K
-4.834K
-1.92%
jan 1, 1993
246.263K
-1.285K
-0.52%
jan 1, 1994
244.027K
-2.236K
-0.91%
jan 1, 1995
244.132K
+105.066
0.04%
jan 1, 1996
241.933K
-2.199K
-0.9%
jan 1, 1997
243.244K
+1.311K
0.54%
jan 1, 1998
245.864K
+2.62K
1.08%
jan 1, 1999
244.292K
-1.572K
-0.64%
jan 1, 2000
237.725K
-6.567K
-2.69%
jan 1, 2001
235.275K
-2.45K
-1.03%
jan 1, 2002
236.883K
+1.608K
0.68%
jan 1, 2003
233.344K
-3.539K
-1.49%
jan 1, 2004
229.793K
-3.551K
-1.52%
jan 1, 2005
224.176K
-5.617K
-2.44%
jan 1, 2006
213.075K
-11.101K
-4.95%
jan 1, 2007
214.471K
+1.397K
0.66%
jan 1, 2008
216.025K
+1.554K
0.72%
jan 1, 2009
219.505K
+3.481K
1.61%
Ranking of countries by current statistics by years


Comments: