29
/
en
AIzaSyAYiBZKx7MnpbEhh9jyipgxe19OcubqV5w
April 1, 2024
153805
Iceland
ISL
true
2
1
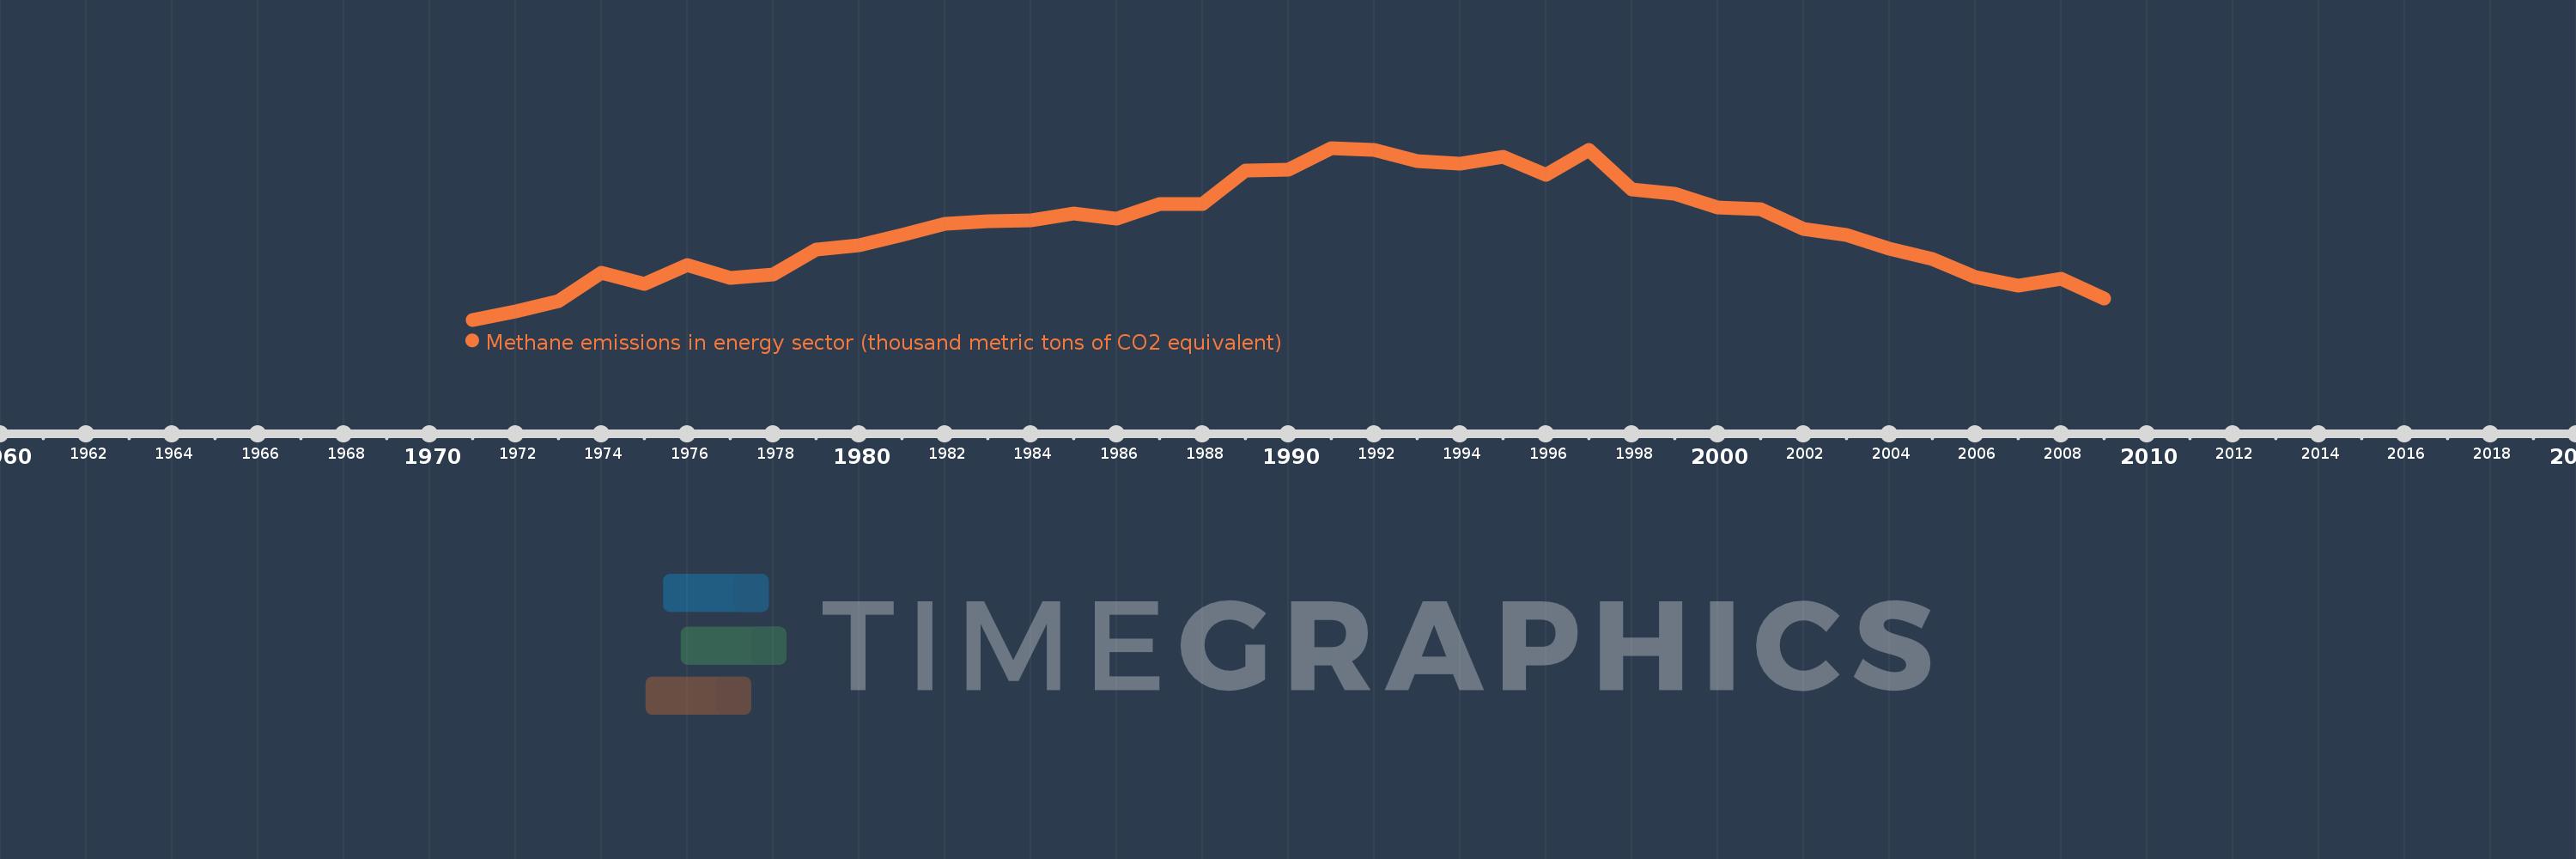
Methane emissions in energy sector (thousand metric tons of CO2 equivalent)
2009,2008,2007,2006,2005,2004,2003,2002,2001,2000,1999,1998,1997,1996,1995,1994,1993,1992,1991,1990,1989,1988,1987,1986,1985,1984,1983,1982,1981,1980,1979,1978,1977,1976,1975,1974,1973,1972,1971
This statistics in other country:
AfghanistanAlbaniaAlgeriaAmerican SamoaAndorraAngolaAntigua and BarbudaArab WorldArgentinaArmeniaArubaAustraliaAustriaAzerbaijanBahamas, TheBahrainBangladeshBarbadosBelarusBelgiumBelizeBeninBermudaBhutanBoliviaBosnia and HerzegovinaBotswanaBrazilBritish Virgin IslandsBrunei DarussalamBulgariaBurkina FasoBurundiCabo VerdeCambodiaCameroonCanadaCaribbean small statesCayman IslandsCentral African RepublicCentral Europe and the BalticsChadChannel IslandsChileChinaColombiaComorosCongo, Dem. Rep.Congo, Rep.Costa RicaCote d'IvoireCroatiaCubaCuracaoCyprusCzech RepublicDenmarkDjiboutiDominicaDominican RepublicEarly-demographic dividendEast Asia & PacificEast Asia & Pacific (excluding high income)East Asia & Pacific (IDA & IBRD countries)EcuadorEgypt, Arab Rep.El SalvadorEquatorial GuineaEritreaEstoniaEthiopiaEuro areaEurope & Central AsiaEurope & Central Asia (excluding high income)Europe & Central Asia (IDA & IBRD countries)European UnionFaroe IslandsFijiFinlandFragile and conflict affected situationsFranceFrench PolynesiaGabonGambia, TheGeorgiaGermanyGhanaGibraltarGreeceGreenlandGrenadaGuamGuatemalaGuineaGuinea-BissauGuyanaHaitiHeavily indebted poor countries (HIPC)High incomeHondurasHong Kong SAR, ChinaHungaryIBRD onlyIcelandIDA & IBRD totalIDA blendIDA onlyIDA totalIndiaIndonesiaIran, Islamic Rep.IraqIrelandIsle of ManIsraelItalyJamaicaJapanJordanKazakhstanKenyaKiribatiKorea, Dem. People’s Rep.Korea, Rep.KosovoKuwaitKyrgyz RepublicLao PDRLate-demographic dividendLatin America & Caribbean Latin America & Caribbean (excluding high income)Latin America & the Caribbean (IDA & IBRD countries)LatviaLeast developed countries: UN classificationLebanonLesothoLiberiaLibyaLiechtensteinLithuaniaLow & middle incomeLow incomeLower middle incomeLuxembourgMacao SAR, ChinaMacedonia, FYRMadagascarMalawiMalaysiaMaldivesMaliMaltaMarshall IslandsMauritaniaMauritiusMexicoMicronesia, Fed. Sts.Middle East & North AfricaMiddle East & North Africa (excluding high income)Middle East & North Africa (IDA & IBRD countries)Middle incomeMoldovaMonacoMongoliaMontenegroMoroccoMozambiqueMyanmarNamibiaNauruNepalNetherlandsNew CaledoniaNew ZealandNicaraguaNigerNigeriaNorth AmericaNorthern Mariana IslandsNorwayOECD membersOmanOther small statesPacific island small statesPakistanPalauPanamaPapua New GuineaParaguayPeruPhilippinesPolandPortugalPost-demographic dividendPre-demographic dividendPuerto RicoQatarRomaniaRussian FederationRwandaSamoaSan MarinoSao Tome and PrincipeSaudi ArabiaSenegalSerbiaSeychellesSierra LeoneSingaporeSint Maarten (Dutch part)Slovak RepublicSloveniaSmall statesSolomon IslandsSomaliaSouth AfricaSouth AsiaSouth Asia (IDA & IBRD)South SudanSpainSri LankaSt. Kitts and NevisSt. LuciaSt. Martin (French part)St. Vincent and the GrenadinesSub-Saharan Africa Sub-Saharan Africa (excluding high income)Sub-Saharan Africa (IDA & IBRD countries)SudanSurinameSwazilandSwedenSwitzerlandSyrian Arab RepublicTajikistanTanzaniaThailandTimor-LesteTogoTongaTrinidad and TobagoTunisiaTurkeyTurkmenistanTurks and Caicos IslandsTuvaluUgandaUkraineUnited Arab EmiratesUnited KingdomUnited StatesUpper middle incomeUruguayUzbekistanVanuatuVenezuela, RBVietnamVirgin Islands (U.S.)West Bank and GazaWorldYemen, Rep.ZambiaZimbabwe Timeline:
This timeline shows a graph from 1971 to 2009 of Iceland. No data until 1970. Number of actual observations by date: 39.
Source name:
World Development Indicators
Source organization:
European Commission, Joint Research Centre (JRC)/Netherlands Environmental Assessment Agency (PBL). Emission Database for Global Atmospheric Research (EDGAR): http://edgar.jrc.ec.europa.eu/
Categories, topics:
Energy & Mining, Environment
Last updated:
apr 23, 2017
Indicators value changes by year
At the date of observation
Value
Absolute change
Change from previous value
jan 1, 1971
2.987
+2.987
0.0%
jan 1, 1972
3.185
+0.199
6.65%
jan 1, 1973
3.429
+0.244
7.66%
jan 1, 1974
4.09
+0.661
19.28%
jan 1, 1975
3.831
-0.259
-6.34%
jan 1, 1976
4.258
+0.426
11.13%
jan 1, 1977
3.964
-0.293
-6.89%
jan 1, 1978
4.048
+0.084
2.11%
jan 1, 1979
4.623
+0.575
14.2%
jan 1, 1980
4.722
+0.099
2.15%
jan 1, 1981
4.957
+0.235
4.98%
jan 1, 1982
5.233
+0.276
5.57%
jan 1, 1983
5.289
+0.055
1.05%
jan 1, 1984
5.301
+0.013
0.24%
jan 1, 1985
5.458
+0.157
2.97%
jan 1, 1986
5.352
-0.107
-1.96%
jan 1, 1987
5.686
+0.335
6.25%
jan 1, 1988
5.686
0.0
0.0%
jan 1, 1989
6.469
+0.783
13.76%
jan 1, 1990
6.482
+0.014
0.21%
jan 1, 1991
6.998
+0.516
7.96%
jan 1, 1992
6.961
-0.037
-0.53%
jan 1, 1993
6.682
-0.28
-4.02%
jan 1, 1994
6.623
-0.059
-0.88%
jan 1, 1995
6.8
+0.177
2.68%
jan 1, 1996
6.373
-0.427
-6.27%
jan 1, 1997
6.949
+0.575
9.03%
jan 1, 1998
6.024
-0.924
-13.3%
jan 1, 1999
5.921
-0.104
-1.72%
jan 1, 2000
5.603
-0.318
-5.37%
jan 1, 2001
5.577
-0.025
-0.45%
jan 1, 2002
5.111
-0.467
-8.37%
jan 1, 2003
4.967
-0.144
-2.81%
jan 1, 2004
4.636
-0.331
-6.67%
jan 1, 2005
4.413
-0.222
-4.79%
jan 1, 2006
3.983
-0.43
-9.75%
jan 1, 2007
3.775
-0.208
-5.22%
jan 1, 2008
3.951
+0.176
4.67%
jan 1, 2009
3.478
-0.473
-11.97%
Ranking of countries by current statistics by years


Comments: