29
/
en
AIzaSyAYiBZKx7MnpbEhh9jyipgxe19OcubqV5w
April 1, 2024
65021
Albania
ALB
true
2
1
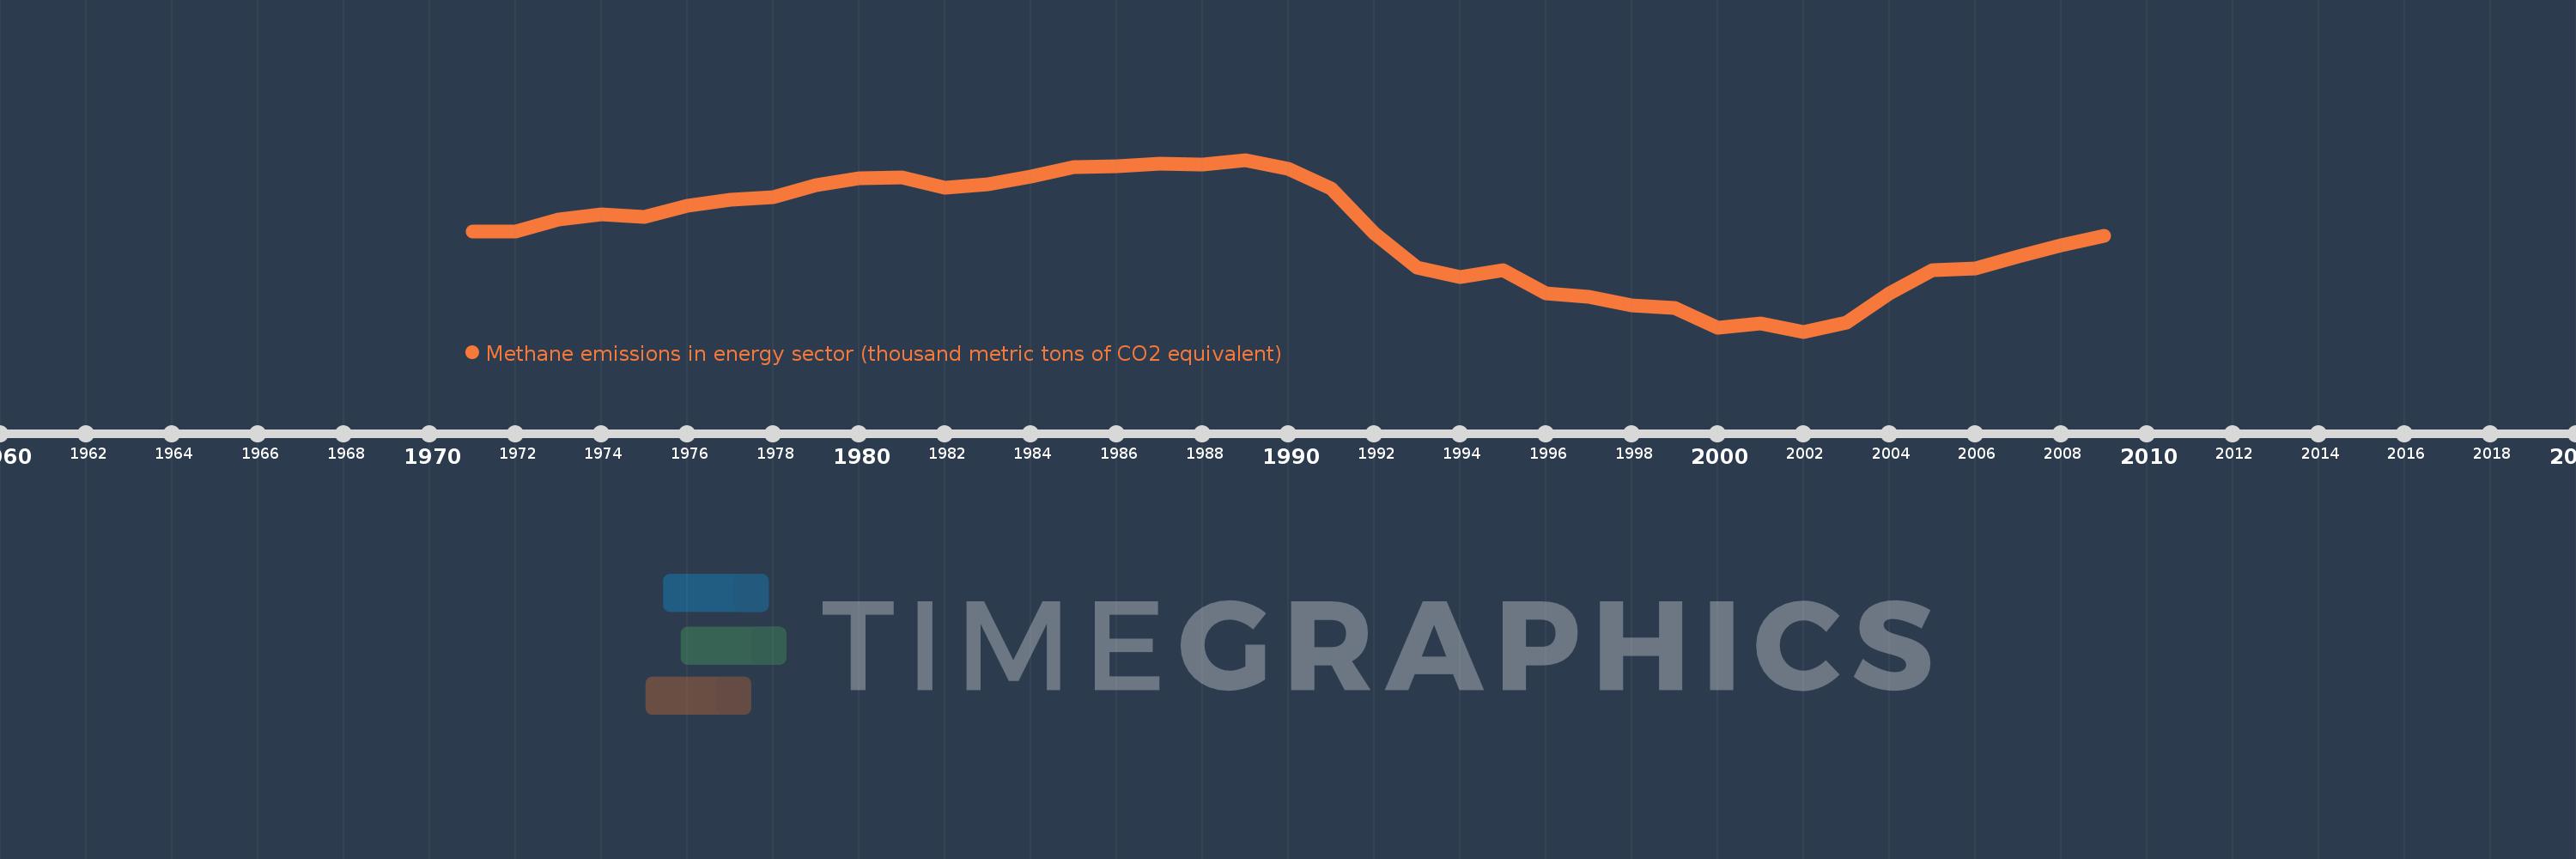
Methane emissions in energy sector (thousand metric tons of CO2 equivalent)
2009,2008,2007,2006,2005,2004,2003,2002,2001,2000,1999,1998,1997,1996,1995,1994,1993,1992,1991,1990,1989,1988,1987,1986,1985,1984,1983,1982,1981,1980,1979,1978,1977,1976,1975,1974,1973,1972,1971
This statistics in other country:
AfghanistanAlbaniaAlgeriaAmerican SamoaAndorraAngolaAntigua and BarbudaArab WorldArgentinaArmeniaArubaAustraliaAustriaAzerbaijanBahamas, TheBahrainBangladeshBarbadosBelarusBelgiumBelizeBeninBermudaBhutanBoliviaBosnia and HerzegovinaBotswanaBrazilBritish Virgin IslandsBrunei DarussalamBulgariaBurkina FasoBurundiCabo VerdeCambodiaCameroonCanadaCaribbean small statesCayman IslandsCentral African RepublicCentral Europe and the BalticsChadChannel IslandsChileChinaColombiaComorosCongo, Dem. Rep.Congo, Rep.Costa RicaCote d'IvoireCroatiaCubaCuracaoCyprusCzech RepublicDenmarkDjiboutiDominicaDominican RepublicEarly-demographic dividendEast Asia & PacificEast Asia & Pacific (excluding high income)East Asia & Pacific (IDA & IBRD countries)EcuadorEgypt, Arab Rep.El SalvadorEquatorial GuineaEritreaEstoniaEthiopiaEuro areaEurope & Central AsiaEurope & Central Asia (excluding high income)Europe & Central Asia (IDA & IBRD countries)European UnionFaroe IslandsFijiFinlandFragile and conflict affected situationsFranceFrench PolynesiaGabonGambia, TheGeorgiaGermanyGhanaGibraltarGreeceGreenlandGrenadaGuamGuatemalaGuineaGuinea-BissauGuyanaHaitiHeavily indebted poor countries (HIPC)High incomeHondurasHong Kong SAR, ChinaHungaryIBRD onlyIcelandIDA & IBRD totalIDA blendIDA onlyIDA totalIndiaIndonesiaIran, Islamic Rep.IraqIrelandIsle of ManIsraelItalyJamaicaJapanJordanKazakhstanKenyaKiribatiKorea, Dem. People’s Rep.Korea, Rep.KosovoKuwaitKyrgyz RepublicLao PDRLate-demographic dividendLatin America & Caribbean Latin America & Caribbean (excluding high income)Latin America & the Caribbean (IDA & IBRD countries)LatviaLeast developed countries: UN classificationLebanonLesothoLiberiaLibyaLiechtensteinLithuaniaLow & middle incomeLow incomeLower middle incomeLuxembourgMacao SAR, ChinaMacedonia, FYRMadagascarMalawiMalaysiaMaldivesMaliMaltaMarshall IslandsMauritaniaMauritiusMexicoMicronesia, Fed. Sts.Middle East & North AfricaMiddle East & North Africa (excluding high income)Middle East & North Africa (IDA & IBRD countries)Middle incomeMoldovaMonacoMongoliaMontenegroMoroccoMozambiqueMyanmarNamibiaNauruNepalNetherlandsNew CaledoniaNew ZealandNicaraguaNigerNigeriaNorth AmericaNorthern Mariana IslandsNorwayOECD membersOmanOther small statesPacific island small statesPakistanPalauPanamaPapua New GuineaParaguayPeruPhilippinesPolandPortugalPost-demographic dividendPre-demographic dividendPuerto RicoQatarRomaniaRussian FederationRwandaSamoaSan MarinoSao Tome and PrincipeSaudi ArabiaSenegalSerbiaSeychellesSierra LeoneSingaporeSint Maarten (Dutch part)Slovak RepublicSloveniaSmall statesSolomon IslandsSomaliaSouth AfricaSouth AsiaSouth Asia (IDA & IBRD)South SudanSpainSri LankaSt. Kitts and NevisSt. LuciaSt. Martin (French part)St. Vincent and the GrenadinesSub-Saharan Africa Sub-Saharan Africa (excluding high income)Sub-Saharan Africa (IDA & IBRD countries)SudanSurinameSwazilandSwedenSwitzerlandSyrian Arab RepublicTajikistanTanzaniaThailandTimor-LesteTogoTongaTrinidad and TobagoTunisiaTurkeyTurkmenistanTurks and Caicos IslandsTuvaluUgandaUkraineUnited Arab EmiratesUnited KingdomUnited StatesUpper middle incomeUruguayUzbekistanVanuatuVenezuela, RBVietnamVirgin Islands (U.S.)West Bank and GazaWorldYemen, Rep.ZambiaZimbabwe Timeline:
This timeline shows a graph from 1971 to 2009 of Albania. No data until 1970. Number of actual observations by date: 39.
Source name:
World Development Indicators
Source organization:
European Commission, Joint Research Centre (JRC)/Netherlands Environmental Assessment Agency (PBL). Emission Database for Global Atmospheric Research (EDGAR): http://edgar.jrc.ec.europa.eu/
Categories, topics:
Energy & Mining, Environment
Last updated:
apr 23, 2017
Indicators value changes by year
Minimum:
359.585
jan 1, 2002
Maximum:
880.341
jan 1, 1989
At the date of observation
Value
Absolute change
Change from previous value
jan 1, 1971
663.568
+663.568
0.0%
jan 1, 1972
663.425
-0.142
-0.02%
jan 1, 1973
698.319
+34.894
5.26%
jan 1, 1974
714.288
+15.968
2.29%
jan 1, 1975
707.15
-7.138
-1.0%
jan 1, 1976
740.574
+33.424
4.73%
jan 1, 1977
760.304
+19.73
2.66%
jan 1, 1978
768.085
+7.781
1.02%
jan 1, 1979
804.673
+36.588
4.76%
jan 1, 1980
825.066
+20.393
2.53%
jan 1, 1981
825.982
+0.916
0.11%
jan 1, 1982
796.574
-29.408
-3.56%
jan 1, 1983
807.296
+10.722
1.35%
jan 1, 1984
828.904
+21.608
2.68%
jan 1, 1985
857.83
+28.926
3.49%
jan 1, 1986
861.091
+3.261
0.38%
jan 1, 1987
869.411
+8.32
0.97%
jan 1, 1988
865.845
-3.566
-0.41%
jan 1, 1989
880.341
+14.496
1.67%
jan 1, 1990
853.819
-26.522
-3.01%
jan 1, 1991
793.704
-60.115
-7.04%
jan 1, 1992
656.785
-136.919
-17.25%
jan 1, 1993
554.814
-101.972
-15.53%
jan 1, 1994
525.126
-29.687
-5.35%
jan 1, 1995
546.136
+21.009
4.0%
jan 1, 1996
475.497
-70.639
-12.93%
jan 1, 1997
466.019
-9.478
-1.99%
jan 1, 1998
440.056
-25.963
-5.57%
jan 1, 1999
431.686
-8.369
-1.9%
jan 1, 2000
372.488
-59.198
-13.71%
jan 1, 2001
383.897
+11.409
3.06%
jan 1, 2002
359.585
-24.312
-6.33%
jan 1, 2003
388.056
+28.471
7.92%
jan 1, 2004
476.399
+88.343
22.77%
jan 1, 2005
545.624
+69.226
14.53%
jan 1, 2006
550.993
+5.369
0.98%
jan 1, 2007
588.135
+37.142
6.74%
jan 1, 2008
620.421
+32.286
5.49%
jan 1, 2009
649.121
+28.7
4.63%
Ranking of countries by current statistics by years


Comments: