29
/
en
AIzaSyAYiBZKx7MnpbEhh9jyipgxe19OcubqV5w
April 1, 2024
80840
Belarus
BLR
true
2
1
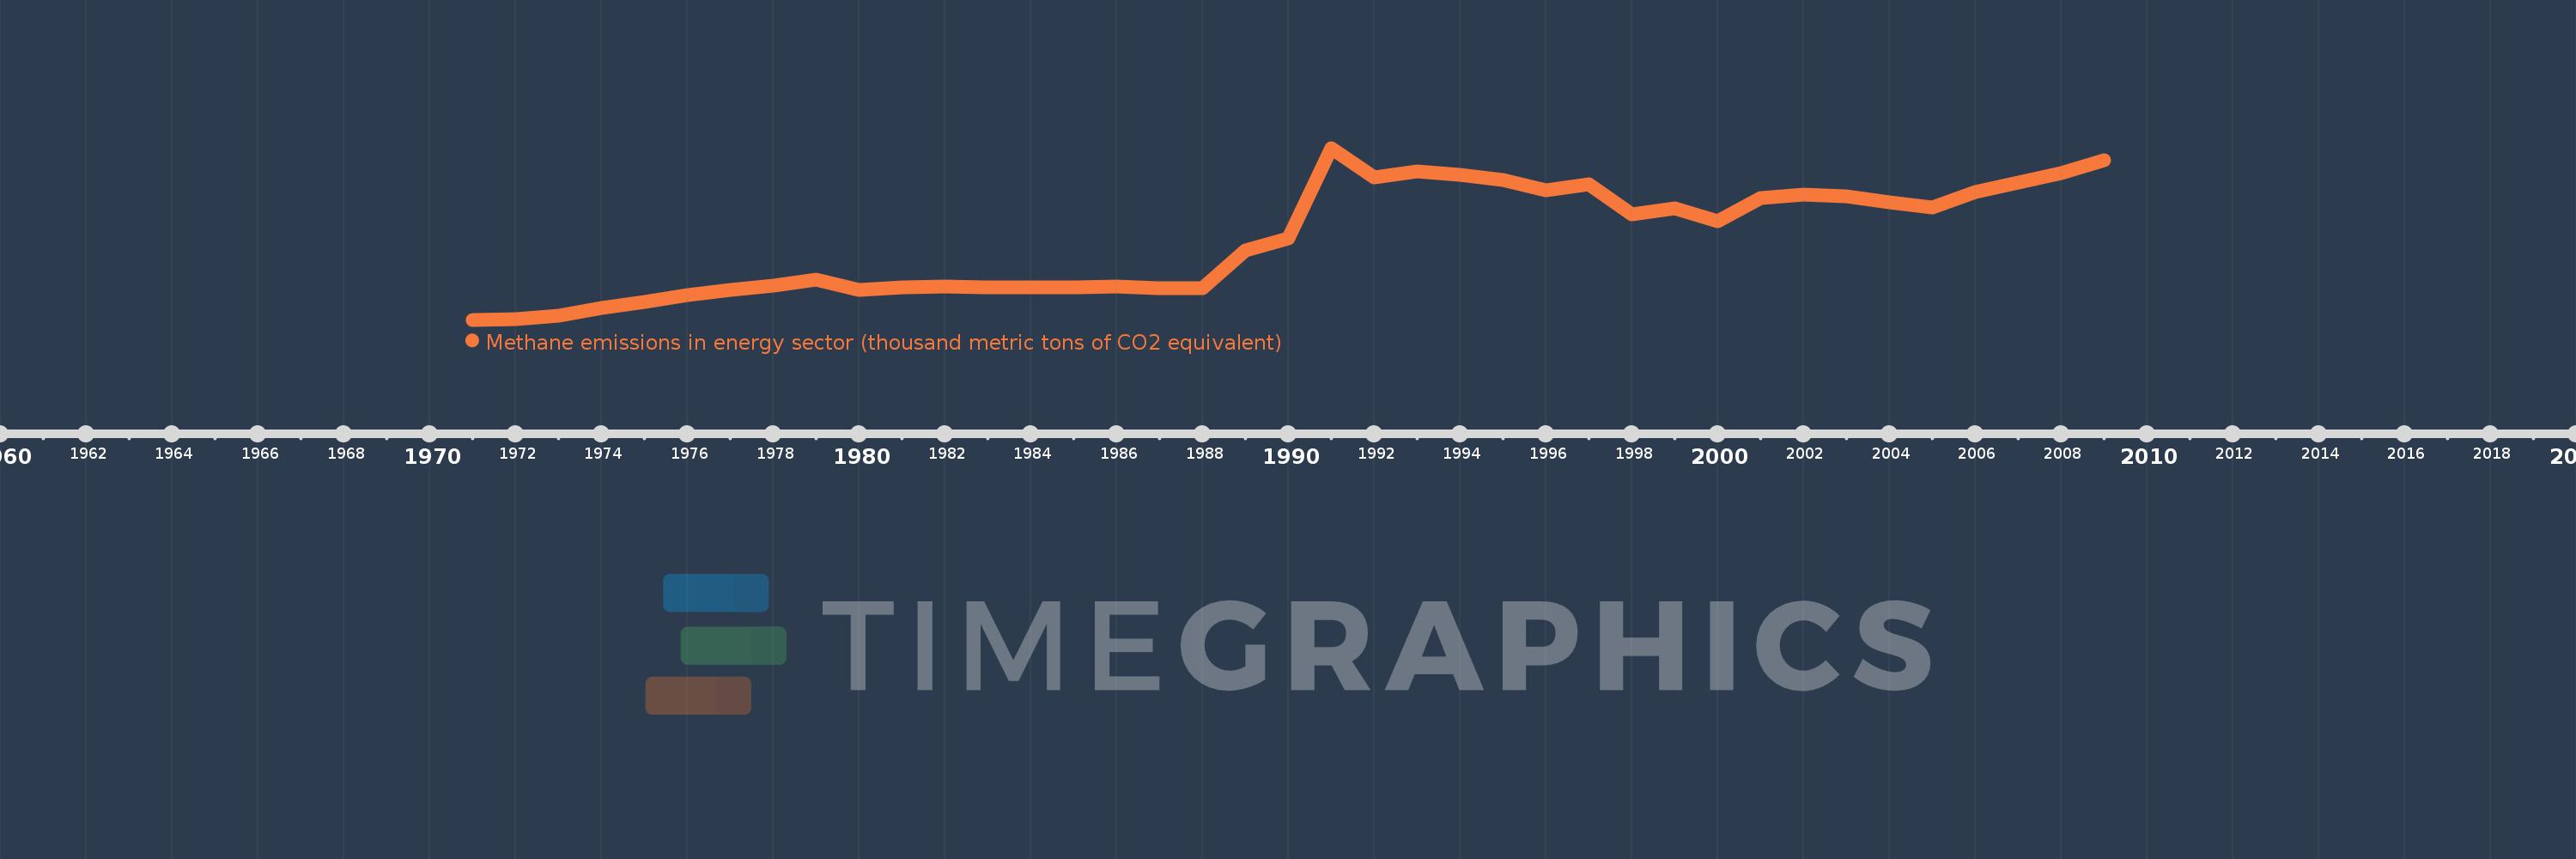
Methane emissions in energy sector (thousand metric tons of CO2 equivalent)
2009,2008,2007,2006,2005,2004,2003,2002,2001,2000,1999,1998,1997,1996,1995,1994,1993,1992,1991,1990,1989,1988,1987,1986,1985,1984,1983,1982,1981,1980,1979,1978,1977,1976,1975,1974,1973,1972,1971
This statistics in other country:
AfghanistanAlbaniaAlgeriaAmerican SamoaAndorraAngolaAntigua and BarbudaArab WorldArgentinaArmeniaArubaAustraliaAustriaAzerbaijanBahamas, TheBahrainBangladeshBarbadosBelarusBelgiumBelizeBeninBermudaBhutanBoliviaBosnia and HerzegovinaBotswanaBrazilBritish Virgin IslandsBrunei DarussalamBulgariaBurkina FasoBurundiCabo VerdeCambodiaCameroonCanadaCaribbean small statesCayman IslandsCentral African RepublicCentral Europe and the BalticsChadChannel IslandsChileChinaColombiaComorosCongo, Dem. Rep.Congo, Rep.Costa RicaCote d'IvoireCroatiaCubaCuracaoCyprusCzech RepublicDenmarkDjiboutiDominicaDominican RepublicEarly-demographic dividendEast Asia & PacificEast Asia & Pacific (excluding high income)East Asia & Pacific (IDA & IBRD countries)EcuadorEgypt, Arab Rep.El SalvadorEquatorial GuineaEritreaEstoniaEthiopiaEuro areaEurope & Central AsiaEurope & Central Asia (excluding high income)Europe & Central Asia (IDA & IBRD countries)European UnionFaroe IslandsFijiFinlandFragile and conflict affected situationsFranceFrench PolynesiaGabonGambia, TheGeorgiaGermanyGhanaGibraltarGreeceGreenlandGrenadaGuamGuatemalaGuineaGuinea-BissauGuyanaHaitiHeavily indebted poor countries (HIPC)High incomeHondurasHong Kong SAR, ChinaHungaryIBRD onlyIcelandIDA & IBRD totalIDA blendIDA onlyIDA totalIndiaIndonesiaIran, Islamic Rep.IraqIrelandIsle of ManIsraelItalyJamaicaJapanJordanKazakhstanKenyaKiribatiKorea, Dem. People’s Rep.Korea, Rep.KosovoKuwaitKyrgyz RepublicLao PDRLate-demographic dividendLatin America & Caribbean Latin America & Caribbean (excluding high income)Latin America & the Caribbean (IDA & IBRD countries)LatviaLeast developed countries: UN classificationLebanonLesothoLiberiaLibyaLiechtensteinLithuaniaLow & middle incomeLow incomeLower middle incomeLuxembourgMacao SAR, ChinaMacedonia, FYRMadagascarMalawiMalaysiaMaldivesMaliMaltaMarshall IslandsMauritaniaMauritiusMexicoMicronesia, Fed. Sts.Middle East & North AfricaMiddle East & North Africa (excluding high income)Middle East & North Africa (IDA & IBRD countries)Middle incomeMoldovaMonacoMongoliaMontenegroMoroccoMozambiqueMyanmarNamibiaNauruNepalNetherlandsNew CaledoniaNew ZealandNicaraguaNigerNigeriaNorth AmericaNorthern Mariana IslandsNorwayOECD membersOmanOther small statesPacific island small statesPakistanPalauPanamaPapua New GuineaParaguayPeruPhilippinesPolandPortugalPost-demographic dividendPre-demographic dividendPuerto RicoQatarRomaniaRussian FederationRwandaSamoaSan MarinoSao Tome and PrincipeSaudi ArabiaSenegalSerbiaSeychellesSierra LeoneSingaporeSint Maarten (Dutch part)Slovak RepublicSloveniaSmall statesSolomon IslandsSomaliaSouth AfricaSouth AsiaSouth Asia (IDA & IBRD)South SudanSpainSri LankaSt. Kitts and NevisSt. LuciaSt. Martin (French part)St. Vincent and the GrenadinesSub-Saharan Africa Sub-Saharan Africa (excluding high income)Sub-Saharan Africa (IDA & IBRD countries)SudanSurinameSwazilandSwedenSwitzerlandSyrian Arab RepublicTajikistanTanzaniaThailandTimor-LesteTogoTongaTrinidad and TobagoTunisiaTurkeyTurkmenistanTurks and Caicos IslandsTuvaluUgandaUkraineUnited Arab EmiratesUnited KingdomUnited StatesUpper middle incomeUruguayUzbekistanVanuatuVenezuela, RBVietnamVirgin Islands (U.S.)West Bank and GazaWorldYemen, Rep.ZambiaZimbabwe Timeline:
This timeline shows a graph from 1971 to 2009 of Belarus. No data until 1970. Number of actual observations by date: 39.
Source name:
World Development Indicators
Source organization:
European Commission, Joint Research Centre (JRC)/Netherlands Environmental Assessment Agency (PBL). Emission Database for Global Atmospheric Research (EDGAR): http://edgar.jrc.ec.europa.eu/
Categories, topics:
Energy & Mining, Environment
Last updated:
apr 23, 2017
Indicators value changes by year
Minimum:
466.575
jan 1, 1971
Maximum:
1.125K
jan 1, 1991
At the date of observation
Value
Absolute change
Change from previous value
jan 1, 1971
466.575
+466.575
0.0%
jan 1, 1972
467.578
+1.003
0.21%
jan 1, 1973
482.753
+15.175
3.25%
jan 1, 1974
511.36
+28.608
5.93%
jan 1, 1975
536.009
+24.649
4.82%
jan 1, 1976
560.118
+24.109
4.5%
jan 1, 1977
581.701
+21.583
3.85%
jan 1, 1978
598.385
+16.684
2.87%
jan 1, 1979
618.904
+20.519
3.43%
jan 1, 1980
580.005
-38.898
-6.29%
jan 1, 1981
591.151
+11.146
1.92%
jan 1, 1982
592.899
+1.748
0.3%
jan 1, 1983
591.523
-1.375
-0.23%
jan 1, 1984
591.039
-0.484
-0.08%
jan 1, 1985
590.309
-0.73
-0.12%
jan 1, 1986
594.227
+3.918
0.66%
jan 1, 1987
589.056
-5.171
-0.87%
jan 1, 1988
587.803
-1.253
-0.21%
jan 1, 1989
732.377
+144.574
24.6%
jan 1, 1990
779.584
+47.207
6.45%
jan 1, 1991
1.125K
+345.912
44.37%
jan 1, 1992
1.012K
-113.677
-10.1%
jan 1, 1993
1.034K
+22.455
2.22%
jan 1, 1994
1.023K
-10.892
-1.05%
jan 1, 1995
1.003K
-20.555
-2.01%
jan 1, 1996
961.741
-41.086
-4.1%
jan 1, 1997
984.547
+22.806
2.37%
jan 1, 1998
869.853
-114.694
-11.65%
jan 1, 1999
893.884
+24.03
2.76%
jan 1, 2000
843.174
-50.709
-5.67%
jan 1, 2001
933.167
+89.993
10.67%
jan 1, 2002
947.669
+14.502
1.55%
jan 1, 2003
941.054
-6.616
-0.7%
jan 1, 2004
918.164
-22.89
-2.43%
jan 1, 2005
898.23
-19.934
-2.17%
jan 1, 2006
954.896
+56.666
6.31%
jan 1, 2007
991.532
+36.636
3.84%
jan 1, 2008
1.03K
+38.344
3.87%
jan 1, 2009
1.077K
+47.223
4.59%
Ranking of countries by current statistics by years


Comments: