29
/
en
AIzaSyAYiBZKx7MnpbEhh9jyipgxe19OcubqV5w
April 1, 2024
232796
Samoa
WSM
true
2
1
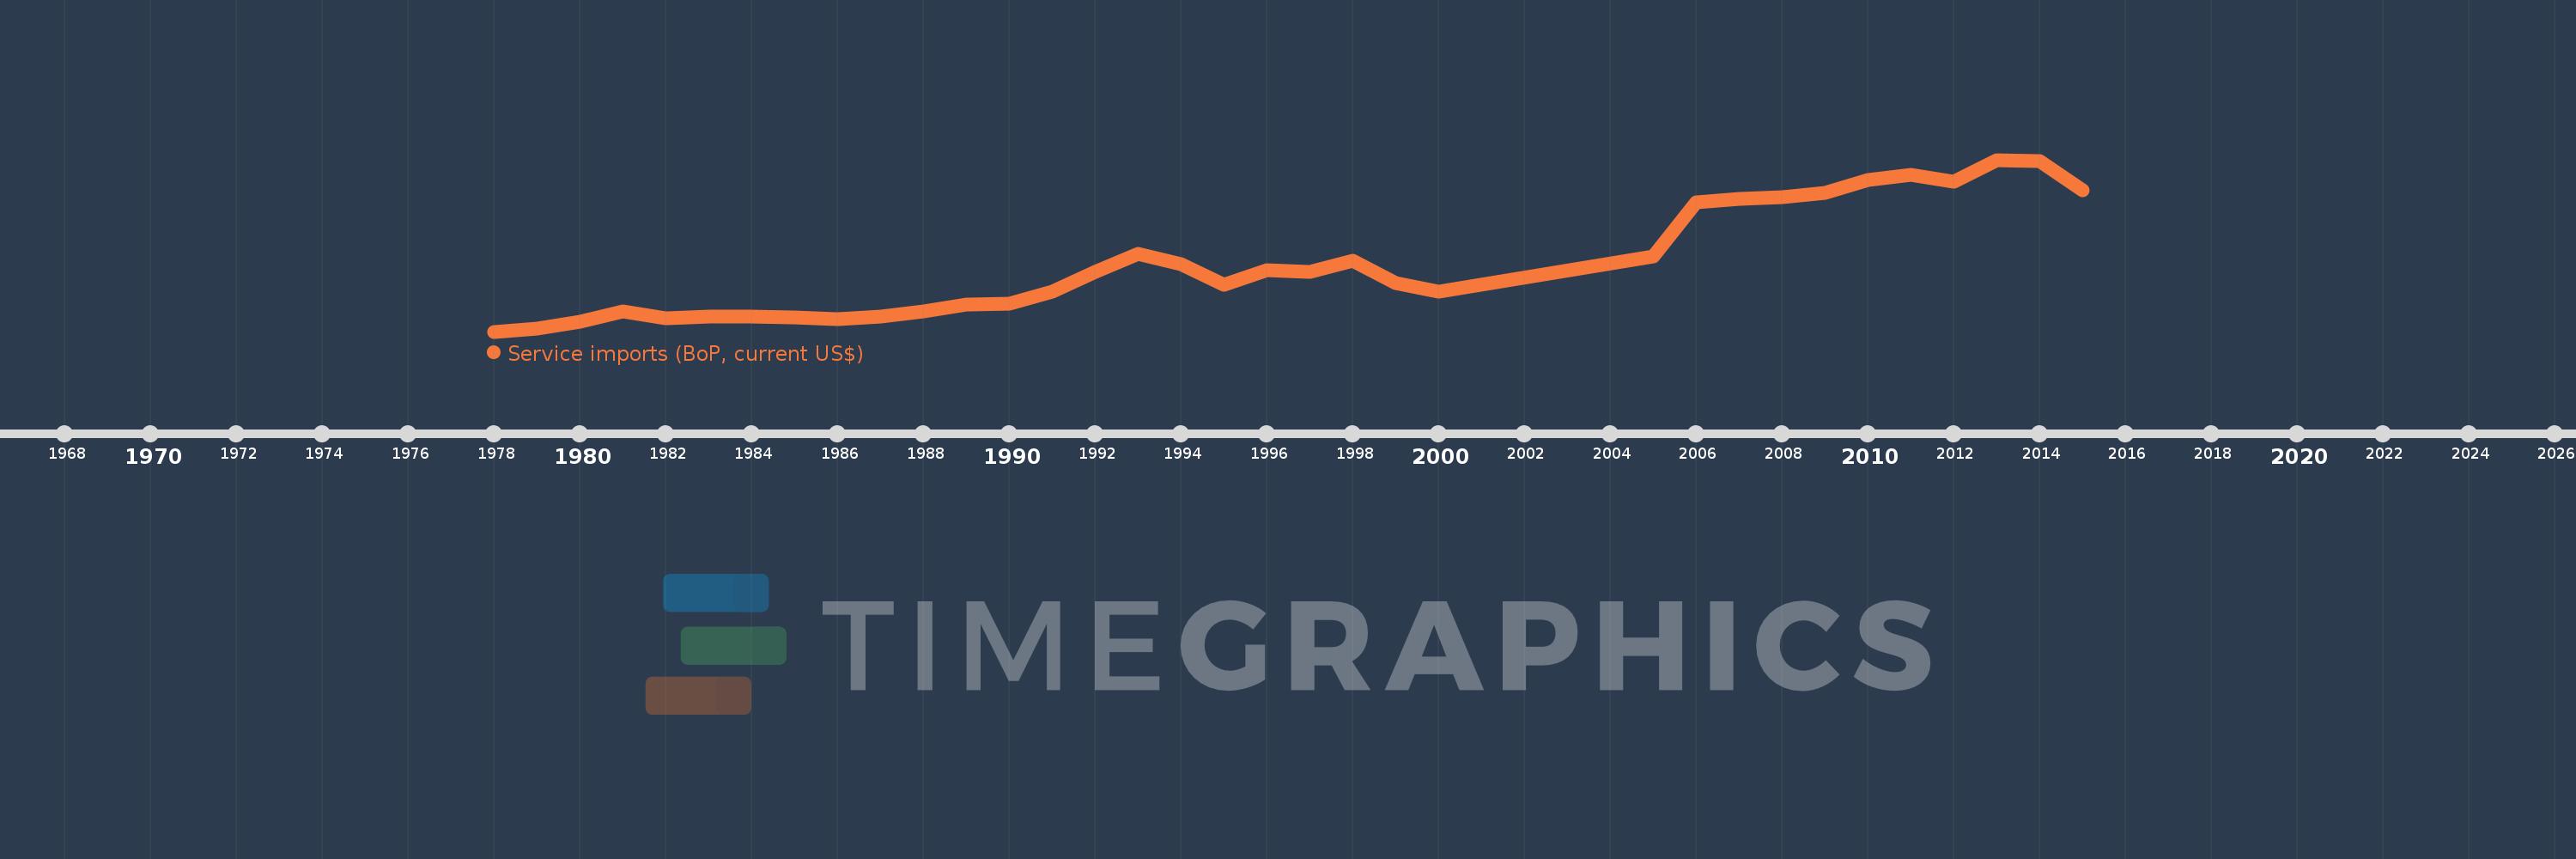
Service imports (BoP, current US$)
2015,2014,2013,2012,2011,2010,2009,2008,2007,2006,2005,2000,1999,1998,1997,1996,1995,1994,1993,1992,1991,1990,1989,1988,1987,1986,1985,1984,1983,1982,1981,1980,1979,1978
This statistics in other country:
AfghanistanAlbaniaAlgeriaAngolaAntigua and BarbudaArab WorldArgentinaArmeniaArubaAustraliaAustriaAzerbaijanBahamas, TheBahrainBangladeshBarbadosBelarusBelgiumBelizeBeninBermudaBhutanBoliviaBosnia and HerzegovinaBotswanaBrazilBrunei DarussalamBulgariaBurkina FasoBurundiCabo VerdeCambodiaCameroonCanadaCaribbean small statesCentral African RepublicCentral Europe and the BalticsChadChileChinaColombiaComorosCongo, Dem. Rep.Congo, Rep.Costa RicaCote d'IvoireCroatiaCuracaoCyprusCzech RepublicDenmarkDjiboutiDominicaDominican RepublicEarly-demographic dividendEast Asia & PacificEast Asia & Pacific (excluding high income)East Asia & Pacific (IDA & IBRD countries)EcuadorEgypt, Arab Rep.El SalvadorEquatorial GuineaEritreaEstoniaEthiopiaEuro areaEurope & Central AsiaEurope & Central Asia (excluding high income)Europe & Central Asia (IDA & IBRD countries)European UnionFaroe IslandsFijiFinlandFragile and conflict affected situationsFranceFrench PolynesiaGabonGambia, TheGeorgiaGermanyGhanaGreeceGrenadaGuatemalaGuineaGuinea-BissauGuyanaHaitiHeavily indebted poor countries (HIPC)High incomeHondurasHong Kong SAR, ChinaHungaryIBRD onlyIcelandIDA & IBRD totalIDA blendIDA onlyIDA totalIndiaIndonesiaIran, Islamic Rep.IraqIrelandIsraelItalyJamaicaJapanJordanKazakhstanKenyaKiribatiKorea, Rep.KosovoKuwaitKyrgyz RepublicLao PDRLate-demographic dividendLatin America & Caribbean Latin America & Caribbean (excluding high income)Latin America & the Caribbean (IDA & IBRD countries)LatviaLeast developed countries: UN classificationLebanonLesothoLiberiaLibyaLithuaniaLow & middle incomeLow incomeLower middle incomeLuxembourgMacao SAR, ChinaMacedonia, FYRMadagascarMalawiMalaysiaMaldivesMaliMaltaMarshall IslandsMauritaniaMauritiusMexicoMicronesia, Fed. Sts.Middle East & North Africa (excluding high income)Middle East & North Africa (IDA & IBRD countries)Middle incomeMoldovaMongoliaMontenegroMoroccoMozambiqueMyanmarNamibiaNepalNetherlandsNew CaledoniaNew ZealandNicaraguaNigerNigeriaNorth AmericaNorwayOECD membersOmanOther small statesPacific island small statesPakistanPalauPanamaPapua New GuineaParaguayPeruPhilippinesPolandPortugalPost-demographic dividendPre-demographic dividendQatarRomaniaRussian FederationRwandaSamoaSao Tome and PrincipeSaudi ArabiaSenegalSerbiaSeychellesSierra LeoneSingaporeSint Maarten (Dutch part)Slovak RepublicSloveniaSmall statesSolomon IslandsSouth AfricaSouth AsiaSouth Asia (IDA & IBRD)South SudanSpainSri LankaSt. Kitts and NevisSt. LuciaSt. Vincent and the GrenadinesSub-Saharan Africa Sub-Saharan Africa (excluding high income)Sub-Saharan Africa (IDA & IBRD countries)SudanSurinameSwazilandSwedenSwitzerlandSyrian Arab RepublicTajikistanTanzaniaThailandTimor-LesteTogoTongaTrinidad and TobagoTunisiaTurkeyTuvaluUgandaUkraineUnited KingdomUnited StatesUpper middle incomeUruguayVanuatuVenezuela, RBVietnamWest Bank and GazaWorldYemen, Rep.ZambiaZimbabwe Timeline:
This timeline shows a graph from 1978 to 2015 of Samoa. No data until 1977. Number of actual observations by date: 34.
Source name:
World Development Indicators
Source organization:
International Monetary Fund, Balance of Payments Statistics Yearbook and data files.
Categories, topics:
Economy & Growth, Trade
Last updated:
apr 23, 2017
Indicators value changes by year
Minimum:
5.089 mln
jan 1, 1978
Maximum:
89.649 mln
jan 1, 2013
At the date of observation
Value
Absolute change
Change from previous value
jan 1, 1978
5.089 mln
+5.089 mln
0.0%
jan 1, 1979
6.763 mln
+1.675 mln
32.91%
jan 1, 1980
9.889 mln
+3.126 mln
46.22%
jan 1, 1981
14.859 mln
+4.97 mln
50.26%
jan 1, 1982
11.585 mln
-3.274 mln
-22.03%
jan 1, 1983
12.606 mln
+1.021 mln
8.81%
jan 1, 1984
12.446 mln
-160.615K
-1.27%
jan 1, 1985
12.184 mln
-261.868K
-2.1%
jan 1, 1986
11.086 mln
-1.098 mln
-9.01%
jan 1, 1987
12.376 mln
+1.291 mln
11.64%
jan 1, 1988
14.936 mln
+2.56 mln
20.68%
jan 1, 1989
18.246 mln
+3.31 mln
22.16%
jan 1, 1990
18.796 mln
+549.6K
3.01%
jan 1, 1991
24.781 mln
+5.985 mln
31.84%
jan 1, 1992
34.618 mln
+9.837 mln
39.7%
jan 1, 1993
43.429 mln
+8.811 mln
25.45%
jan 1, 1994
38.243 mln
-5.187 mln
-11.94%
jan 1, 1995
28.165 mln
-10.077 mln
-26.35%
jan 1, 1996
35.194 mln
+7.029 mln
24.96%
jan 1, 1997
34.327 mln
-867.008K
-2.46%
jan 1, 1998
40.08 mln
+5.753 mln
16.76%
jan 1, 1999
29.087 mln
-10.993 mln
-27.43%
jan 1, 2000
24.549 mln
-4.538 mln
-15.6%
jan 1, 2005
41.96 mln
+17.411 mln
70.92%
jan 1, 2006
68.863 mln
+26.903 mln
64.11%
jan 1, 2007
70.571 mln
+1.707 mln
2.48%
jan 1, 2008
71.106 mln
+535.757K
0.76%
jan 1, 2009
73.573 mln
+2.467 mln
3.47%
jan 1, 2010
79.662 mln
+6.088 mln
8.28%
jan 1, 2011
82.185 mln
+2.524 mln
3.17%
jan 1, 2012
78.836 mln
-3.349 mln
-4.08%
jan 1, 2013
89.649 mln
+10.813 mln
13.72%
jan 1, 2014
88.966 mln
-682.855K
-0.76%
jan 1, 2015
74.829 mln
-14.137 mln
-15.89%
Ranking of countries by current statistics by years


Comments: