29
/
en
AIzaSyAYiBZKx7MnpbEhh9jyipgxe19OcubqV5w
April 1, 2024
178292
Lesotho
LSO
true
2
1
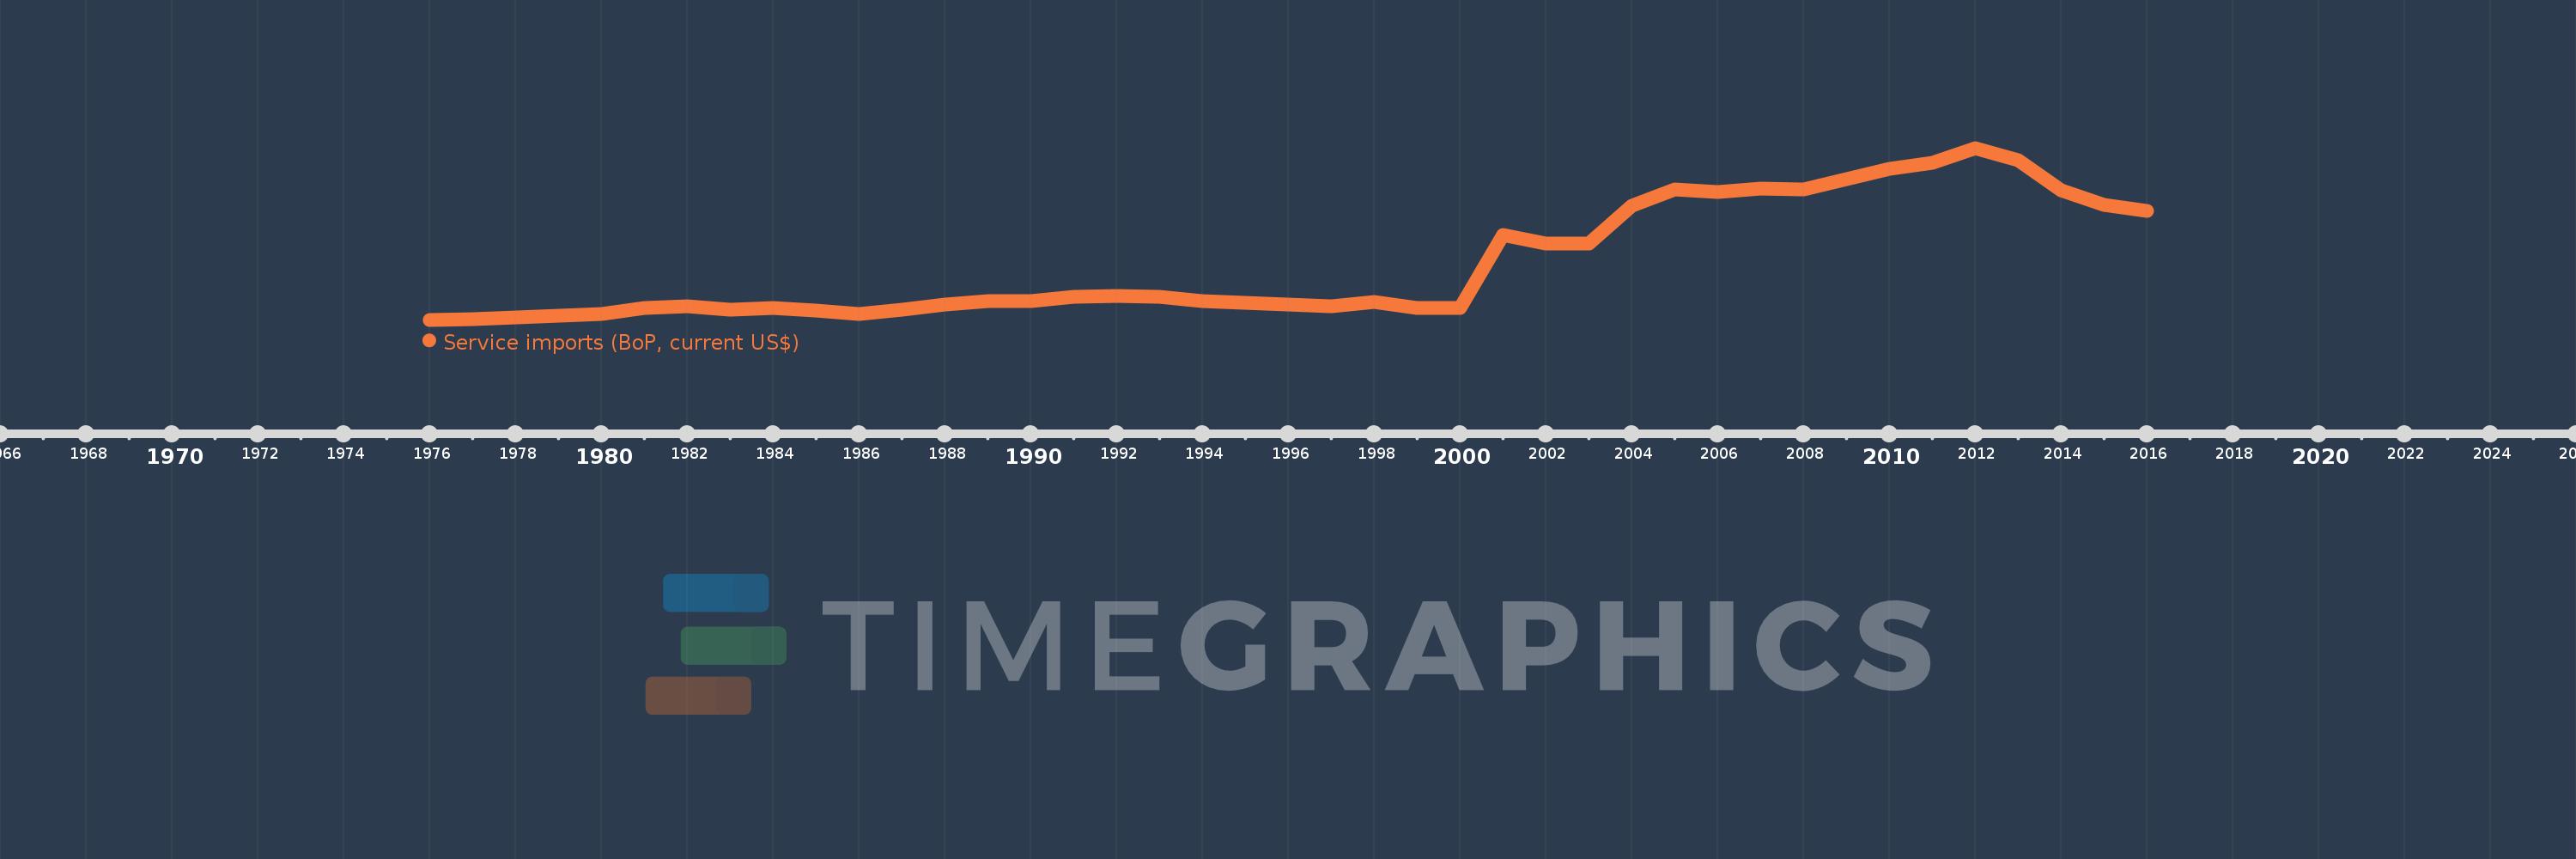
Service imports (BoP, current US$)
2016,2015,2014,2013,2012,2011,2010,2009,2008,2007,2006,2005,2004,2003,2002,2001,2000,1999,1998,1997,1996,1995,1994,1993,1992,1991,1990,1989,1988,1987,1986,1985,1984,1983,1982,1981,1980,1979,1978,1977,1976
This statistics in other country:
AfghanistanAlbaniaAlgeriaAngolaAntigua and BarbudaArab WorldArgentinaArmeniaArubaAustraliaAustriaAzerbaijanBahamas, TheBahrainBangladeshBarbadosBelarusBelgiumBelizeBeninBermudaBhutanBoliviaBosnia and HerzegovinaBotswanaBrazilBrunei DarussalamBulgariaBurkina FasoBurundiCabo VerdeCambodiaCameroonCanadaCaribbean small statesCentral African RepublicCentral Europe and the BalticsChadChileChinaColombiaComorosCongo, Dem. Rep.Congo, Rep.Costa RicaCote d'IvoireCroatiaCuracaoCyprusCzech RepublicDenmarkDjiboutiDominicaDominican RepublicEarly-demographic dividendEast Asia & PacificEast Asia & Pacific (excluding high income)East Asia & Pacific (IDA & IBRD countries)EcuadorEgypt, Arab Rep.El SalvadorEquatorial GuineaEritreaEstoniaEthiopiaEuro areaEurope & Central AsiaEurope & Central Asia (excluding high income)Europe & Central Asia (IDA & IBRD countries)European UnionFaroe IslandsFijiFinlandFragile and conflict affected situationsFranceFrench PolynesiaGabonGambia, TheGeorgiaGermanyGhanaGreeceGrenadaGuatemalaGuineaGuinea-BissauGuyanaHaitiHeavily indebted poor countries (HIPC)High incomeHondurasHong Kong SAR, ChinaHungaryIBRD onlyIcelandIDA & IBRD totalIDA blendIDA onlyIDA totalIndiaIndonesiaIran, Islamic Rep.IraqIrelandIsraelItalyJamaicaJapanJordanKazakhstanKenyaKiribatiKorea, Rep.KosovoKuwaitKyrgyz RepublicLao PDRLate-demographic dividendLatin America & Caribbean Latin America & Caribbean (excluding high income)Latin America & the Caribbean (IDA & IBRD countries)LatviaLeast developed countries: UN classificationLebanonLesothoLiberiaLibyaLithuaniaLow & middle incomeLow incomeLower middle incomeLuxembourgMacao SAR, ChinaMacedonia, FYRMadagascarMalawiMalaysiaMaldivesMaliMaltaMarshall IslandsMauritaniaMauritiusMexicoMicronesia, Fed. Sts.Middle East & North Africa (excluding high income)Middle East & North Africa (IDA & IBRD countries)Middle incomeMoldovaMongoliaMontenegroMoroccoMozambiqueMyanmarNamibiaNepalNetherlandsNew CaledoniaNew ZealandNicaraguaNigerNigeriaNorth AmericaNorwayOECD membersOmanOther small statesPacific island small statesPakistanPalauPanamaPapua New GuineaParaguayPeruPhilippinesPolandPortugalPost-demographic dividendPre-demographic dividendQatarRomaniaRussian FederationRwandaSamoaSao Tome and PrincipeSaudi ArabiaSenegalSerbiaSeychellesSierra LeoneSingaporeSint Maarten (Dutch part)Slovak RepublicSloveniaSmall statesSolomon IslandsSouth AfricaSouth AsiaSouth Asia (IDA & IBRD)South SudanSpainSri LankaSt. Kitts and NevisSt. LuciaSt. Vincent and the GrenadinesSub-Saharan Africa Sub-Saharan Africa (excluding high income)Sub-Saharan Africa (IDA & IBRD countries)SudanSurinameSwazilandSwedenSwitzerlandSyrian Arab RepublicTajikistanTanzaniaThailandTimor-LesteTogoTongaTrinidad and TobagoTunisiaTurkeyTuvaluUgandaUkraineUnited KingdomUnited StatesUpper middle incomeUruguayVanuatuVenezuela, RBVietnamWest Bank and GazaWorldYemen, Rep.ZambiaZimbabwe Timeline:
This timeline shows a graph from 1976 to 2016 of Lesotho. No data until 1975. Number of actual observations by date: 41.
Source name:
World Development Indicators
Source organization:
International Monetary Fund, Balance of Payments Statistics Yearbook and data files.
Categories, topics:
Economy & Growth, Trade
Last updated:
apr 23, 2017
Indicators value changes by year
Minimum:
19.067 mln
jan 1, 1976
Maximum:
487.845 mln
jan 1, 2012
At the date of observation
Value
Absolute change
Change from previous value
jan 1, 1976
19.067 mln
+19.067 mln
0.0%
jan 1, 1977
20.93 mln
+1.863 mln
9.77%
jan 1, 1978
24.84 mln
+3.91 mln
18.68%
jan 1, 1979
29.9 mln
+5.06 mln
20.37%
jan 1, 1980
35.272 mln
+5.372 mln
17.97%
jan 1, 1981
50.332 mln
+15.059 mln
42.69%
jan 1, 1982
55.155 mln
+4.823 mln
9.58%
jan 1, 1983
46.684 mln
-8.471 mln
-15.36%
jan 1, 1984
50.22 mln
+3.536 mln
7.57%
jan 1, 1985
45.097 mln
-5.123 mln
-10.2%
jan 1, 1986
35.528 mln
-9.569 mln
-21.22%
jan 1, 1987
46.205 mln
+10.677 mln
30.05%
jan 1, 1988
60.692 mln
+14.488 mln
31.36%
jan 1, 1989
69.118 mln
+8.426 mln
13.88%
jan 1, 1990
70.887 mln
+1.769 mln
2.56%
jan 1, 1991
81.446 mln
+10.559 mln
14.9%
jan 1, 1992
83.94 mln
+2.494 mln
3.06%
jan 1, 1993
82.777 mln
-1.162 mln
-1.38%
jan 1, 1994
70.48 mln
-12.297 mln
-14.86%
jan 1, 1995
64.209 mln
-6.272 mln
-8.9%
jan 1, 1996
61.074 mln
-3.135 mln
-4.88%
jan 1, 1997
55.932 mln
-5.141 mln
-8.42%
jan 1, 1998
67.599 mln
+11.667 mln
20.86%
jan 1, 1999
52.176 mln
-15.423 mln
-22.82%
jan 1, 2000
50.088 mln
-2.088 mln
-4.0%
jan 1, 2001
249.764 mln
+199.675 mln
398.65%
jan 1, 2002
226.109 mln
-23.654 mln
-9.47%
jan 1, 2003
226.762 mln
+652.244K
0.29%
jan 1, 2004
329.512 mln
+102.75 mln
45.31%
jan 1, 2005
373.863 mln
+44.351 mln
13.46%
jan 1, 2006
367.611 mln
-6.252 mln
-1.67%
jan 1, 2007
377.751 mln
+10.14 mln
2.76%
jan 1, 2008
375.728 mln
-2.023 mln
-0.54%
jan 1, 2009
403.884 mln
+28.157 mln
7.49%
jan 1, 2010
430.34 mln
+26.456 mln
6.55%
jan 1, 2011
446.897 mln
+16.556 mln
3.85%
jan 1, 2012
487.845 mln
+40.948 mln
9.16%
jan 1, 2013
454.597 mln
-33.248 mln
-6.82%
jan 1, 2014
372.564 mln
-82.033 mln
-18.05%
jan 1, 2015
333.528 mln
-39.036 mln
-10.48%
jan 1, 2016
315.424 mln
-18.104 mln
-5.43%
Ranking of countries by current statistics by years


Comments: