29
/
en
AIzaSyAYiBZKx7MnpbEhh9jyipgxe19OcubqV5w
April 1, 2024
168209
Kenya
KEN
true
2
1
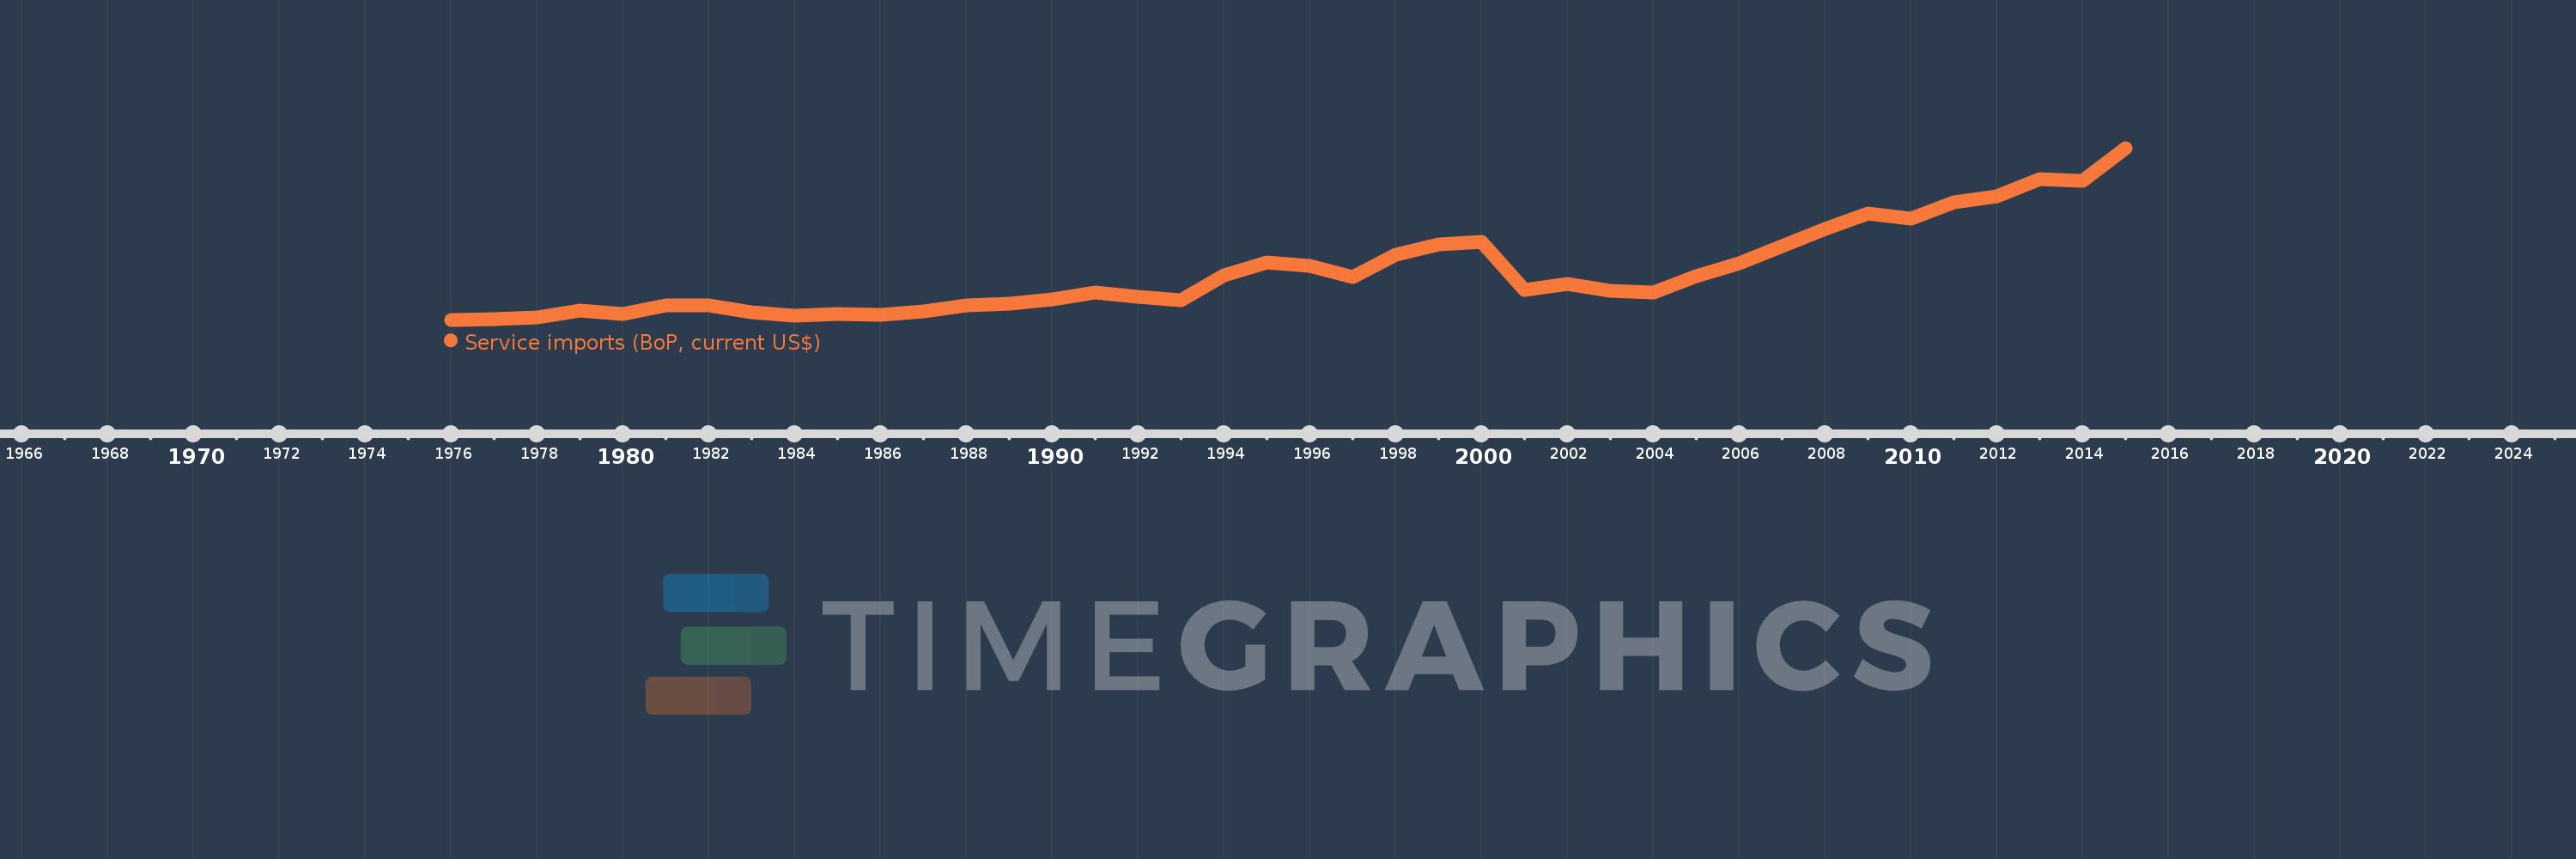
Service imports (BoP, current US$)
2015,2014,2013,2012,2011,2010,2009,2008,2007,2006,2005,2004,2003,2002,2001,2000,1999,1998,1997,1996,1995,1994,1993,1992,1991,1990,1989,1988,1987,1986,1985,1984,1983,1982,1981,1980,1979,1978,1977,1976
This statistics in other country:
AfghanistanAlbaniaAlgeriaAngolaAntigua and BarbudaArab WorldArgentinaArmeniaArubaAustraliaAustriaAzerbaijanBahamas, TheBahrainBangladeshBarbadosBelarusBelgiumBelizeBeninBermudaBhutanBoliviaBosnia and HerzegovinaBotswanaBrazilBrunei DarussalamBulgariaBurkina FasoBurundiCabo VerdeCambodiaCameroonCanadaCaribbean small statesCentral African RepublicCentral Europe and the BalticsChadChileChinaColombiaComorosCongo, Dem. Rep.Congo, Rep.Costa RicaCote d'IvoireCroatiaCuracaoCyprusCzech RepublicDenmarkDjiboutiDominicaDominican RepublicEarly-demographic dividendEast Asia & PacificEast Asia & Pacific (excluding high income)East Asia & Pacific (IDA & IBRD countries)EcuadorEgypt, Arab Rep.El SalvadorEquatorial GuineaEritreaEstoniaEthiopiaEuro areaEurope & Central AsiaEurope & Central Asia (excluding high income)Europe & Central Asia (IDA & IBRD countries)European UnionFaroe IslandsFijiFinlandFragile and conflict affected situationsFranceFrench PolynesiaGabonGambia, TheGeorgiaGermanyGhanaGreeceGrenadaGuatemalaGuineaGuinea-BissauGuyanaHaitiHeavily indebted poor countries (HIPC)High incomeHondurasHong Kong SAR, ChinaHungaryIBRD onlyIcelandIDA & IBRD totalIDA blendIDA onlyIDA totalIndiaIndonesiaIran, Islamic Rep.IraqIrelandIsraelItalyJamaicaJapanJordanKazakhstanKenyaKiribatiKorea, Rep.KosovoKuwaitKyrgyz RepublicLao PDRLate-demographic dividendLatin America & Caribbean Latin America & Caribbean (excluding high income)Latin America & the Caribbean (IDA & IBRD countries)LatviaLeast developed countries: UN classificationLebanonLesothoLiberiaLibyaLithuaniaLow & middle incomeLow incomeLower middle incomeLuxembourgMacao SAR, ChinaMacedonia, FYRMadagascarMalawiMalaysiaMaldivesMaliMaltaMarshall IslandsMauritaniaMauritiusMexicoMicronesia, Fed. Sts.Middle East & North Africa (excluding high income)Middle East & North Africa (IDA & IBRD countries)Middle incomeMoldovaMongoliaMontenegroMoroccoMozambiqueMyanmarNamibiaNepalNetherlandsNew CaledoniaNew ZealandNicaraguaNigerNigeriaNorth AmericaNorwayOECD membersOmanOther small statesPacific island small statesPakistanPalauPanamaPapua New GuineaParaguayPeruPhilippinesPolandPortugalPost-demographic dividendPre-demographic dividendQatarRomaniaRussian FederationRwandaSamoaSao Tome and PrincipeSaudi ArabiaSenegalSerbiaSeychellesSierra LeoneSingaporeSint Maarten (Dutch part)Slovak RepublicSloveniaSmall statesSolomon IslandsSouth AfricaSouth AsiaSouth Asia (IDA & IBRD)South SudanSpainSri LankaSt. Kitts and NevisSt. LuciaSt. Vincent and the GrenadinesSub-Saharan Africa Sub-Saharan Africa (excluding high income)Sub-Saharan Africa (IDA & IBRD countries)SudanSurinameSwazilandSwedenSwitzerlandSyrian Arab RepublicTajikistanTanzaniaThailandTimor-LesteTogoTongaTrinidad and TobagoTunisiaTurkeyTuvaluUgandaUkraineUnited KingdomUnited StatesUpper middle incomeUruguayVanuatuVenezuela, RBVietnamWest Bank and GazaWorldYemen, Rep.ZambiaZimbabwe Timeline:
This timeline shows a graph from 1976 to 2015 of Kenya. No data until 1975. Number of actual observations by date: 40.
Source name:
World Development Indicators
Source organization:
International Monetary Fund, Balance of Payments Statistics Yearbook and data files.
Categories, topics:
Economy & Growth, Trade
Last updated:
apr 23, 2017
Indicators value changes by year
Minimum:
283.8 mln
jan 1, 1976
Maximum:
2.934 bln
jan 1, 2015
At the date of observation
Value
Absolute change
Change from previous value
jan 1, 1976
283.8 mln
+283.8 mln
0.0%
jan 1, 1977
294.605 mln
+10.804 mln
3.81%
jan 1, 1978
320.906 mln
+26.302 mln
8.93%
jan 1, 1979
428.365 mln
+107.459 mln
33.49%
jan 1, 1980
376.573 mln
-51.792 mln
-12.09%
jan 1, 1981
501.605 mln
+125.032 mln
33.2%
jan 1, 1982
503.012 mln
+1.407 mln
0.28%
jan 1, 1983
398.358 mln
-104.654 mln
-20.81%
jan 1, 1984
341.509 mln
-56.85 mln
-14.27%
jan 1, 1985
376.998 mln
+35.489 mln
10.39%
jan 1, 1986
359.54 mln
-17.458 mln
-4.63%
jan 1, 1987
415.204 mln
+55.665 mln
15.48%
jan 1, 1988
504.725 mln
+89.521 mln
21.56%
jan 1, 1989
530.002 mln
+25.277 mln
5.01%
jan 1, 1990
603.136 mln
+73.134 mln
13.8%
jan 1, 1991
699.68 mln
+96.544 mln
16.01%
jan 1, 1992
632.724 mln
-66.955 mln
-9.57%
jan 1, 1993
578.393 mln
-54.331 mln
-8.59%
jan 1, 1994
973.273 mln
+394.879 mln
68.27%
jan 1, 1995
1.168 bln
+194.627 mln
20.0%
jan 1, 1996
1.111 bln
-56.652 mln
-4.85%
jan 1, 1997
938.793 mln
-172.455 mln
-15.52%
jan 1, 1998
1.287 bln
+348.473 mln
37.12%
jan 1, 1999
1.443 bln
+155.535 mln
12.08%
jan 1, 2000
1.485 bln
+42.607 mln
2.95%
jan 1, 2001
741.066 mln
-744.342 mln
-50.11%
jan 1, 2002
833.233 mln
+92.167 mln
12.44%
jan 1, 2003
725.738 mln
-107.495 mln
-12.9%
jan 1, 2004
706.112 mln
-19.626 mln
-2.7%
jan 1, 2005
955.235 mln
+249.123 mln
35.28%
jan 1, 2006
1.152 bln
+197.024 mln
20.63%
jan 1, 2007
1.419 bln
+266.683 mln
23.14%
jan 1, 2008
1.69 bln
+271.382 mln
19.13%
jan 1, 2009
1.924 bln
+233.231 mln
13.8%
jan 1, 2010
1.84 bln
-83.114 mln
-4.32%
jan 1, 2011
2.089 bln
+248.684 mln
13.51%
jan 1, 2012
2.186 bln
+97.352 mln
4.66%
jan 1, 2013
2.447 bln
+260.869 mln
11.93%
jan 1, 2014
2.422 bln
-25.213 mln
-1.03%
jan 1, 2015
2.934 bln
+511.424 mln
21.11%
Ranking of countries by current statistics by years


Comments: