29
/
en
AIzaSyAYiBZKx7MnpbEhh9jyipgxe19OcubqV5w
April 1, 2024
151102
Honduras
HND
true
2
1
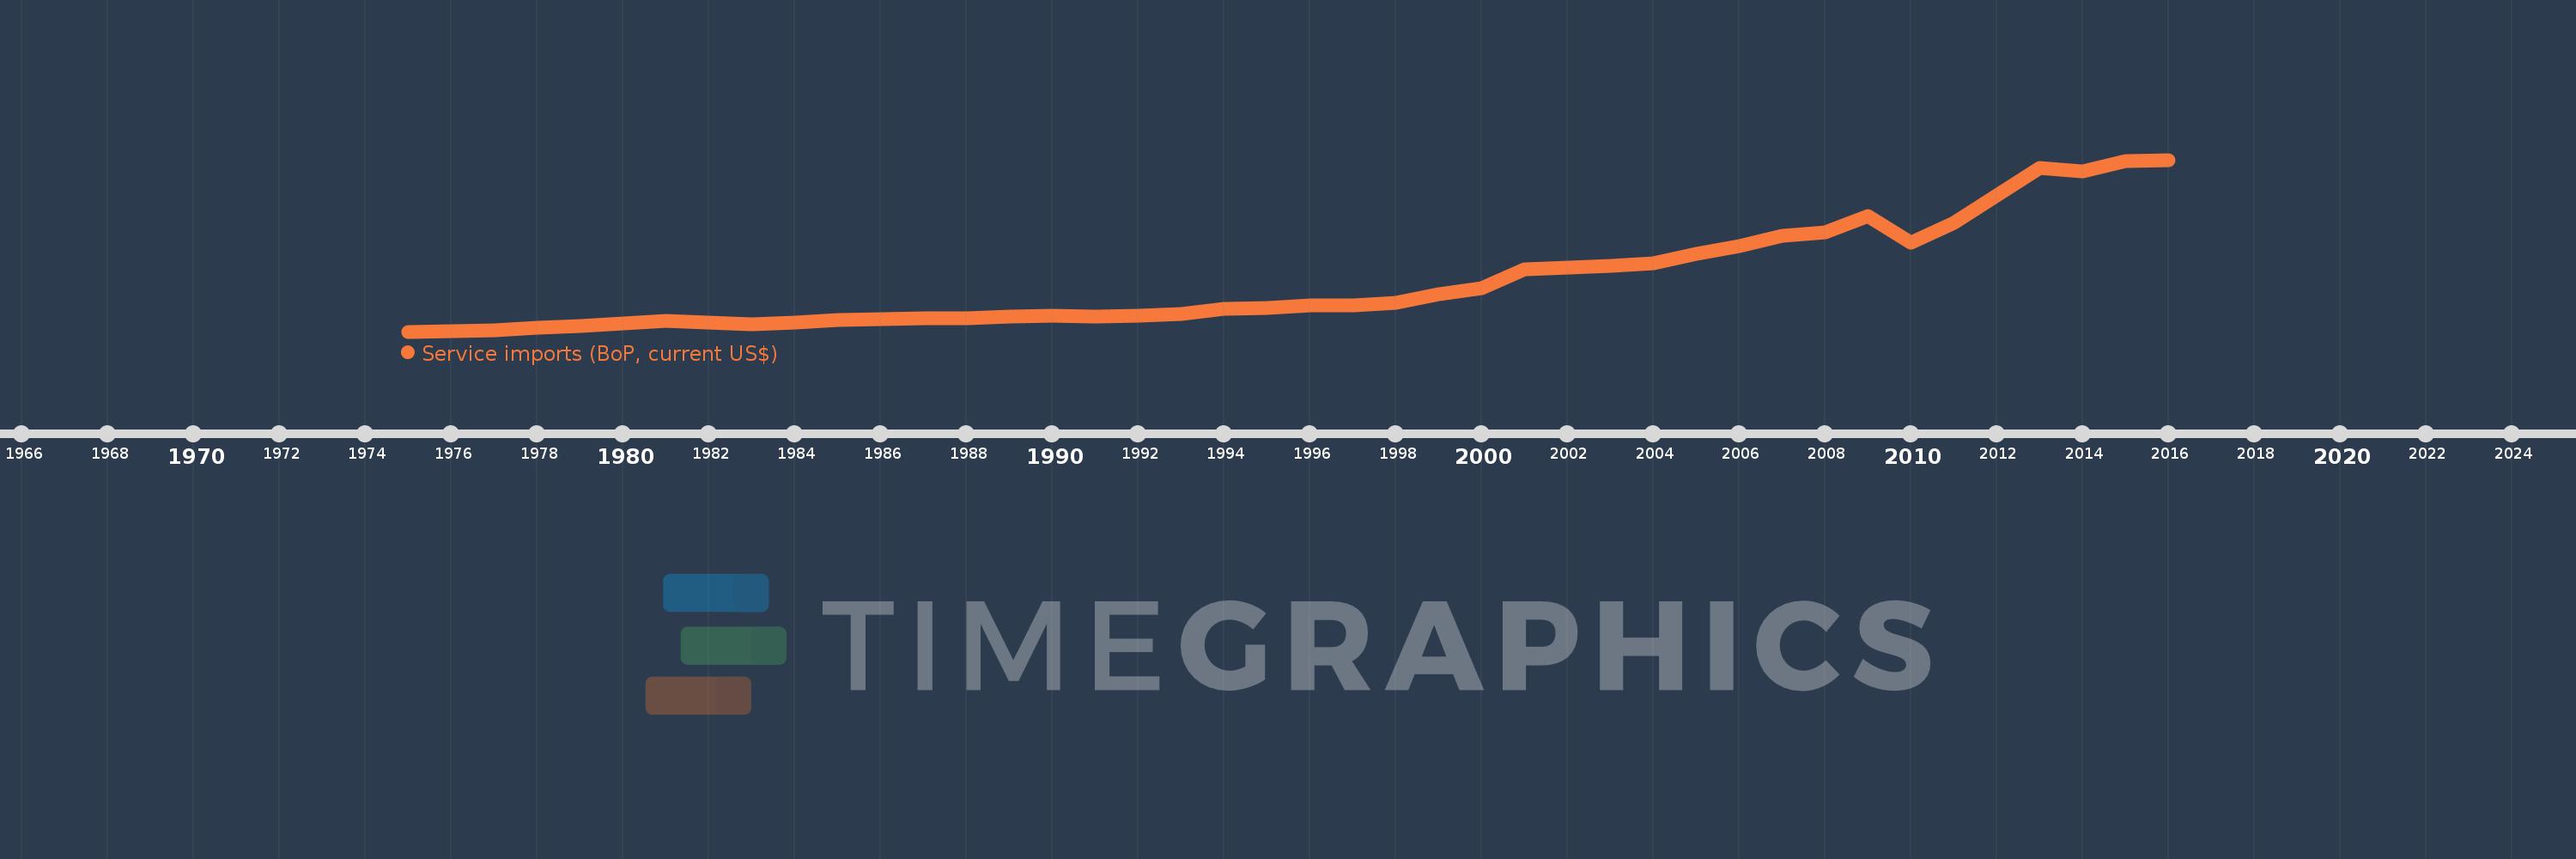
Service imports (BoP, current US$)
2016,2015,2014,2013,2012,2011,2010,2009,2008,2007,2006,2005,2004,2003,2002,2001,2000,1999,1998,1997,1996,1995,1994,1993,1992,1991,1990,1989,1988,1987,1986,1985,1984,1983,1982,1981,1980,1979,1978,1977,1976,1975
This statistics in other country:
AfghanistanAlbaniaAlgeriaAngolaAntigua and BarbudaArab WorldArgentinaArmeniaArubaAustraliaAustriaAzerbaijanBahamas, TheBahrainBangladeshBarbadosBelarusBelgiumBelizeBeninBermudaBhutanBoliviaBosnia and HerzegovinaBotswanaBrazilBrunei DarussalamBulgariaBurkina FasoBurundiCabo VerdeCambodiaCameroonCanadaCaribbean small statesCentral African RepublicCentral Europe and the BalticsChadChileChinaColombiaComorosCongo, Dem. Rep.Congo, Rep.Costa RicaCote d'IvoireCroatiaCuracaoCyprusCzech RepublicDenmarkDjiboutiDominicaDominican RepublicEarly-demographic dividendEast Asia & PacificEast Asia & Pacific (excluding high income)East Asia & Pacific (IDA & IBRD countries)EcuadorEgypt, Arab Rep.El SalvadorEquatorial GuineaEritreaEstoniaEthiopiaEuro areaEurope & Central AsiaEurope & Central Asia (excluding high income)Europe & Central Asia (IDA & IBRD countries)European UnionFaroe IslandsFijiFinlandFragile and conflict affected situationsFranceFrench PolynesiaGabonGambia, TheGeorgiaGermanyGhanaGreeceGrenadaGuatemalaGuineaGuinea-BissauGuyanaHaitiHeavily indebted poor countries (HIPC)High incomeHondurasHong Kong SAR, ChinaHungaryIBRD onlyIcelandIDA & IBRD totalIDA blendIDA onlyIDA totalIndiaIndonesiaIran, Islamic Rep.IraqIrelandIsraelItalyJamaicaJapanJordanKazakhstanKenyaKiribatiKorea, Rep.KosovoKuwaitKyrgyz RepublicLao PDRLate-demographic dividendLatin America & Caribbean Latin America & Caribbean (excluding high income)Latin America & the Caribbean (IDA & IBRD countries)LatviaLeast developed countries: UN classificationLebanonLesothoLiberiaLibyaLithuaniaLow & middle incomeLow incomeLower middle incomeLuxembourgMacao SAR, ChinaMacedonia, FYRMadagascarMalawiMalaysiaMaldivesMaliMaltaMarshall IslandsMauritaniaMauritiusMexicoMicronesia, Fed. Sts.Middle East & North Africa (excluding high income)Middle East & North Africa (IDA & IBRD countries)Middle incomeMoldovaMongoliaMontenegroMoroccoMozambiqueMyanmarNamibiaNepalNetherlandsNew CaledoniaNew ZealandNicaraguaNigerNigeriaNorth AmericaNorwayOECD membersOmanOther small statesPacific island small statesPakistanPalauPanamaPapua New GuineaParaguayPeruPhilippinesPolandPortugalPost-demographic dividendPre-demographic dividendQatarRomaniaRussian FederationRwandaSamoaSao Tome and PrincipeSaudi ArabiaSenegalSerbiaSeychellesSierra LeoneSingaporeSint Maarten (Dutch part)Slovak RepublicSloveniaSmall statesSolomon IslandsSouth AfricaSouth AsiaSouth Asia (IDA & IBRD)South SudanSpainSri LankaSt. Kitts and NevisSt. LuciaSt. Vincent and the GrenadinesSub-Saharan Africa Sub-Saharan Africa (excluding high income)Sub-Saharan Africa (IDA & IBRD countries)SudanSurinameSwazilandSwedenSwitzerlandSyrian Arab RepublicTajikistanTanzaniaThailandTimor-LesteTogoTongaTrinidad and TobagoTunisiaTurkeyTuvaluUgandaUkraineUnited KingdomUnited StatesUpper middle incomeUruguayVanuatuVenezuela, RBVietnamWest Bank and GazaWorldYemen, Rep.ZambiaZimbabwe Timeline:
This timeline shows a graph from 1975 to 2016 of Honduras. No data until 1974. Number of actual observations by date: 42.
Source name:
World Development Indicators
Source organization:
International Monetary Fund, Balance of Payments Statistics Yearbook and data files.
Categories, topics:
Economy & Growth, Trade
Last updated:
apr 23, 2017
Indicators value changes by year
Minimum:
68.3 mln
jan 1, 1975
Maximum:
1.803 bln
jan 1, 2016
At the date of observation
Value
Absolute change
Change from previous value
jan 1, 1975
68.3 mln
+68.3 mln
0.0%
jan 1, 1976
73.75 mln
+5.45 mln
7.98%
jan 1, 1977
82.15 mln
+8.4 mln
11.39%
jan 1, 1978
105.4 mln
+23.25 mln
28.3%
jan 1, 1979
123.1 mln
+17.7 mln
16.79%
jan 1, 1980
148.2 mln
+25.1 mln
20.39%
jan 1, 1981
173.95 mln
+25.75 mln
17.38%
jan 1, 1982
163.65 mln
-10.3 mln
-5.92%
jan 1, 1983
144.25 mln
-19.4 mln
-11.85%
jan 1, 1984
158.35 mln
+14.1 mln
9.77%
jan 1, 1985
183.15 mln
+24.8 mln
15.66%
jan 1, 1986
195.3 mln
+12.15 mln
6.63%
jan 1, 1987
198.6 mln
+3.3 mln
1.69%
jan 1, 1988
202.43 mln
+3.83 mln
1.93%
jan 1, 1989
217.5 mln
+15.07 mln
7.44%
jan 1, 1990
230.5 mln
+13.0 mln
5.98%
jan 1, 1991
219.8 mln
-10.7 mln
-4.64%
jan 1, 1992
226.7 mln
+6.9 mln
3.14%
jan 1, 1993
243.2 mln
+16.5 mln
7.28%
jan 1, 1994
294.7 mln
+51.5 mln
21.18%
jan 1, 1995
311.0 mln
+16.3 mln
5.53%
jan 1, 1996
333.7 mln
+22.7 mln
7.3%
jan 1, 1997
329.5 mln
-4.2 mln
-1.26%
jan 1, 1998
362.8 mln
+33.3 mln
10.11%
jan 1, 1999
446.8 mln
+84.0 mln
23.15%
jan 1, 2000
502.4 mln
+55.6 mln
12.44%
jan 1, 2001
693.839 mln
+191.439 mln
38.1%
jan 1, 2002
712.511 mln
+18.672 mln
2.69%
jan 1, 2003
732.222 mln
+19.711 mln
2.77%
jan 1, 2004
755.806 mln
+23.584 mln
3.22%
jan 1, 2005
849.314 mln
+93.508 mln
12.37%
jan 1, 2006
929.219 mln
+79.905 mln
9.41%
jan 1, 2007
1.036 bln
+106.647 mln
11.48%
jan 1, 2008
1.069 bln
+32.973 mln
3.18%
jan 1, 2009
1.239 bln
+169.669 mln
15.87%
jan 1, 2010
963.961 mln
-274.547 mln
-22.17%
jan 1, 2011
1.169 bln
+204.897 mln
21.26%
jan 1, 2012
1.446 bln
+277.389 mln
23.73%
jan 1, 2013
1.722 bln
+275.869 mln
19.07%
jan 1, 2014
1.689 bln
-32.939 mln
-1.91%
jan 1, 2015
1.793 bln
+104.038 mln
6.16%
jan 1, 2016
1.803 bln
+9.792 mln
0.55%
Ranking of countries by current statistics by years


Comments: