29
/
en
AIzaSyAYiBZKx7MnpbEhh9jyipgxe19OcubqV5w
April 1, 2024
133626
Finland
FIN
true
2
1
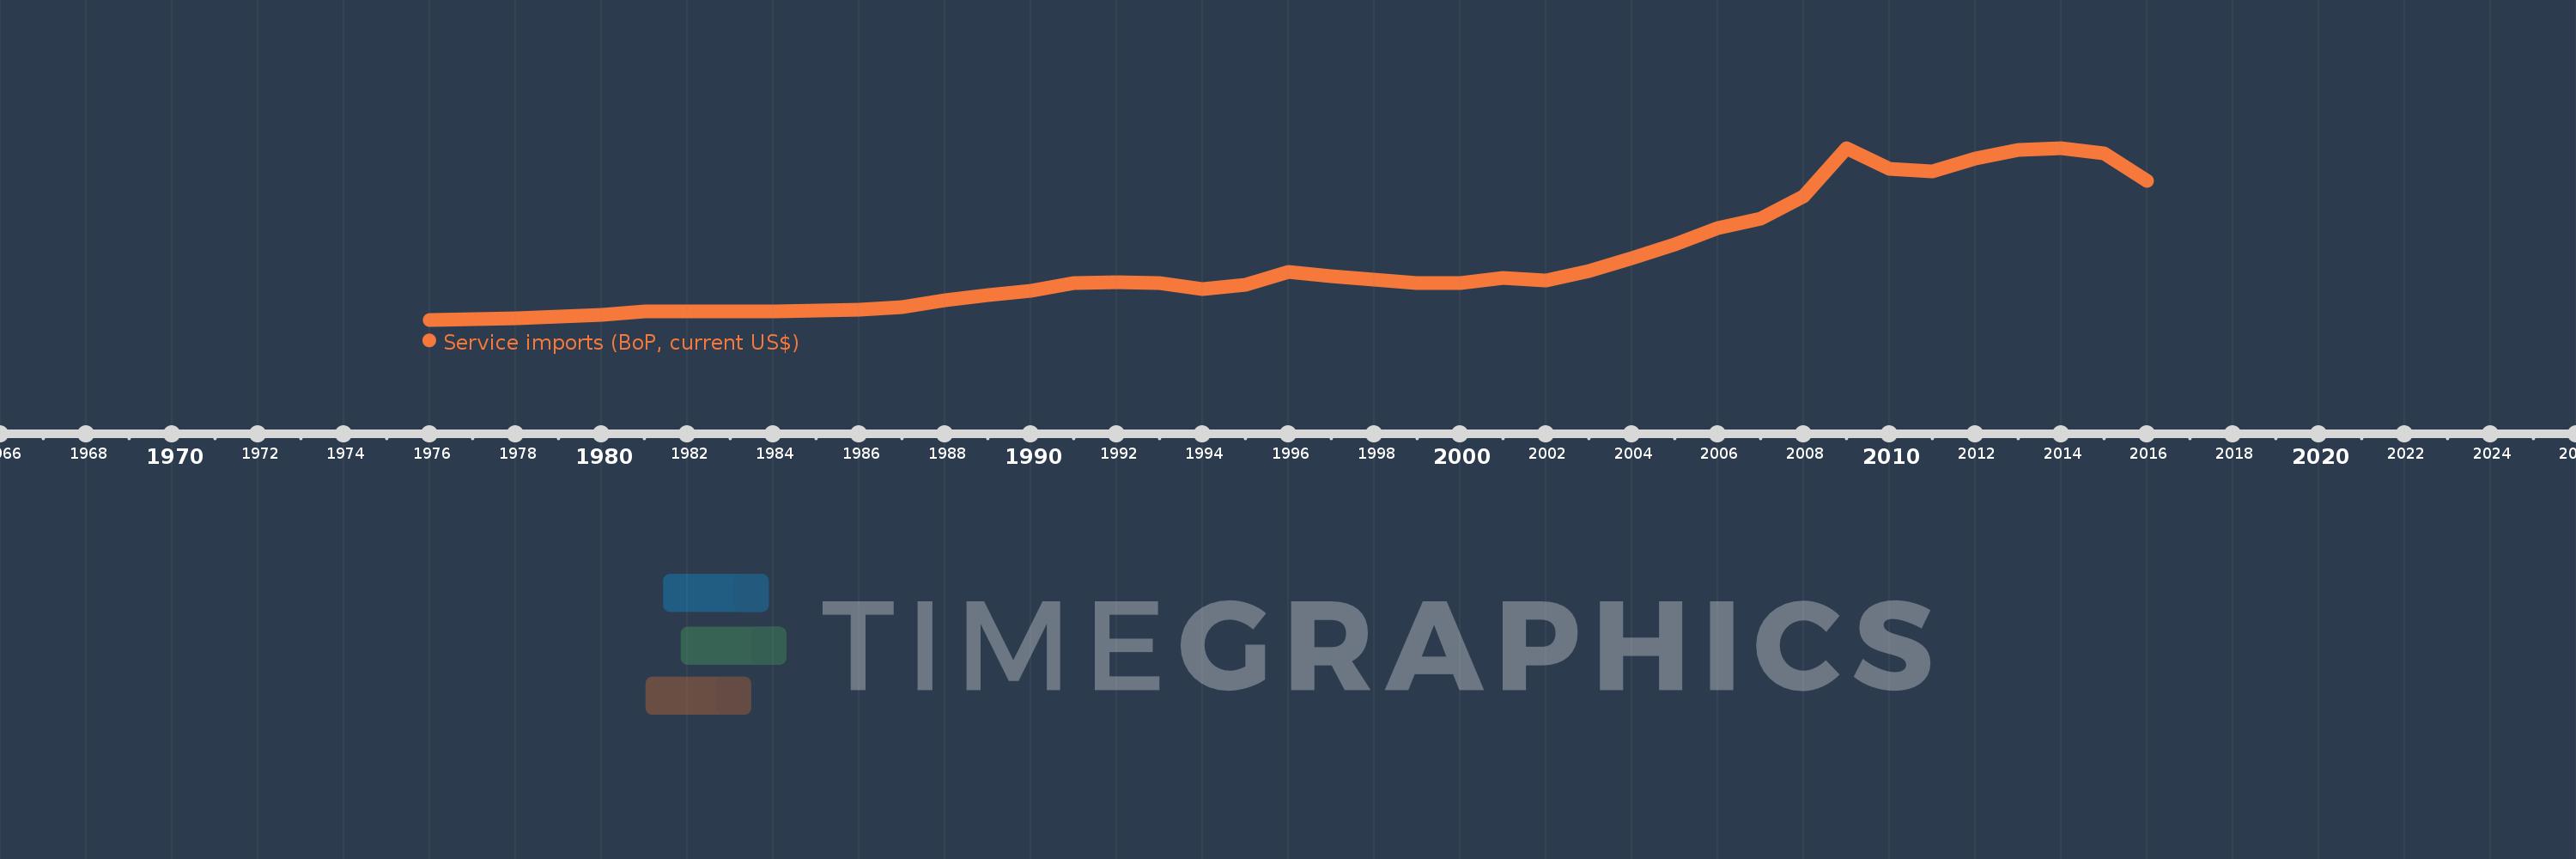
Service imports (BoP, current US$)
2016,2015,2014,2013,2012,2011,2010,2009,2008,2007,2006,2005,2004,2003,2002,2001,2000,1999,1998,1997,1996,1995,1994,1993,1992,1991,1990,1989,1988,1987,1986,1985,1984,1983,1982,1981,1980,1979,1978,1977,1976
This statistics in other country:
AfghanistanAlbaniaAlgeriaAngolaAntigua and BarbudaArab WorldArgentinaArmeniaArubaAustraliaAustriaAzerbaijanBahamas, TheBahrainBangladeshBarbadosBelarusBelgiumBelizeBeninBermudaBhutanBoliviaBosnia and HerzegovinaBotswanaBrazilBrunei DarussalamBulgariaBurkina FasoBurundiCabo VerdeCambodiaCameroonCanadaCaribbean small statesCentral African RepublicCentral Europe and the BalticsChadChileChinaColombiaComorosCongo, Dem. Rep.Congo, Rep.Costa RicaCote d'IvoireCroatiaCuracaoCyprusCzech RepublicDenmarkDjiboutiDominicaDominican RepublicEarly-demographic dividendEast Asia & PacificEast Asia & Pacific (excluding high income)East Asia & Pacific (IDA & IBRD countries)EcuadorEgypt, Arab Rep.El SalvadorEquatorial GuineaEritreaEstoniaEthiopiaEuro areaEurope & Central AsiaEurope & Central Asia (excluding high income)Europe & Central Asia (IDA & IBRD countries)European UnionFaroe IslandsFijiFinlandFragile and conflict affected situationsFranceFrench PolynesiaGabonGambia, TheGeorgiaGermanyGhanaGreeceGrenadaGuatemalaGuineaGuinea-BissauGuyanaHaitiHeavily indebted poor countries (HIPC)High incomeHondurasHong Kong SAR, ChinaHungaryIBRD onlyIcelandIDA & IBRD totalIDA blendIDA onlyIDA totalIndiaIndonesiaIran, Islamic Rep.IraqIrelandIsraelItalyJamaicaJapanJordanKazakhstanKenyaKiribatiKorea, Rep.KosovoKuwaitKyrgyz RepublicLao PDRLate-demographic dividendLatin America & Caribbean Latin America & Caribbean (excluding high income)Latin America & the Caribbean (IDA & IBRD countries)LatviaLeast developed countries: UN classificationLebanonLesothoLiberiaLibyaLithuaniaLow & middle incomeLow incomeLower middle incomeLuxembourgMacao SAR, ChinaMacedonia, FYRMadagascarMalawiMalaysiaMaldivesMaliMaltaMarshall IslandsMauritaniaMauritiusMexicoMicronesia, Fed. Sts.Middle East & North Africa (excluding high income)Middle East & North Africa (IDA & IBRD countries)Middle incomeMoldovaMongoliaMontenegroMoroccoMozambiqueMyanmarNamibiaNepalNetherlandsNew CaledoniaNew ZealandNicaraguaNigerNigeriaNorth AmericaNorwayOECD membersOmanOther small statesPacific island small statesPakistanPalauPanamaPapua New GuineaParaguayPeruPhilippinesPolandPortugalPost-demographic dividendPre-demographic dividendQatarRomaniaRussian FederationRwandaSamoaSao Tome and PrincipeSaudi ArabiaSenegalSerbiaSeychellesSierra LeoneSingaporeSint Maarten (Dutch part)Slovak RepublicSloveniaSmall statesSolomon IslandsSouth AfricaSouth AsiaSouth Asia (IDA & IBRD)South SudanSpainSri LankaSt. Kitts and NevisSt. LuciaSt. Vincent and the GrenadinesSub-Saharan Africa Sub-Saharan Africa (excluding high income)Sub-Saharan Africa (IDA & IBRD countries)SudanSurinameSwazilandSwedenSwitzerlandSyrian Arab RepublicTajikistanTanzaniaThailandTimor-LesteTogoTongaTrinidad and TobagoTunisiaTurkeyTuvaluUgandaUkraineUnited KingdomUnited StatesUpper middle incomeUruguayVanuatuVenezuela, RBVietnamWest Bank and GazaWorldYemen, Rep.ZambiaZimbabwe Timeline:
This timeline shows a graph from 1976 to 2016 of Finland. No data until 1975. Number of actual observations by date: 41.
Source name:
World Development Indicators
Source organization:
International Monetary Fund, Balance of Payments Statistics Yearbook and data files.
Categories, topics:
Economy & Growth, Trade
Last updated:
apr 23, 2017
Indicators value changes by year
Minimum:
1.121 bln
jan 1, 1976
Maximum:
31.536 bln
jan 1, 2014
At the date of observation
Value
Absolute change
Change from previous value
jan 1, 1976
1.121 bln
+1.121 bln
0.0%
jan 1, 1977
1.226 bln
+105.318 mln
9.4%
jan 1, 1978
1.391 bln
+164.504 mln
13.42%
jan 1, 1979
1.632 bln
+241.429 mln
17.36%
jan 1, 1980
2.03 bln
+398.129 mln
24.39%
jan 1, 1981
2.58 bln
+549.791 mln
27.08%
jan 1, 1982
2.626 bln
+46.208 mln
1.79%
jan 1, 1983
2.537 bln
-89.567 mln
-3.41%
jan 1, 1984
2.53 bln
-6.636 mln
-0.26%
jan 1, 1985
2.684 bln
+153.762 mln
6.08%
jan 1, 1986
2.928 bln
+244.043 mln
9.09%
jan 1, 1987
3.336 bln
+408.267 mln
13.94%
jan 1, 1988
4.511 bln
+1.175 bln
35.22%
jan 1, 1989
5.506 bln
+994.675 mln
22.05%
jan 1, 1990
6.23 bln
+724.091 mln
13.15%
jan 1, 1991
7.667 bln
+1.437 bln
23.06%
jan 1, 1992
7.693 bln
+26.165 mln
0.34%
jan 1, 1993
7.587 bln
-105.512 mln
-1.37%
jan 1, 1994
6.623 bln
-964.09 mln
-12.71%
jan 1, 1995
7.345 bln
+721.168 mln
10.89%
jan 1, 1996
9.566 bln
+2.221 bln
30.24%
jan 1, 1997
8.869 bln
-696.993 mln
-7.29%
jan 1, 1998
8.288 bln
-580.456 mln
-6.54%
jan 1, 1999
7.595 bln
-692.943 mln
-8.36%
jan 1, 2000
7.657 bln
+61.951 mln
0.82%
jan 1, 2001
8.477 bln
+819.222 mln
10.7%
jan 1, 2002
8.14 bln
-336.235 mln
-3.97%
jan 1, 2003
9.747 bln
+1.607 bln
19.74%
jan 1, 2004
11.998 bln
+2.251 bln
23.09%
jan 1, 2005
14.426 bln
+2.428 bln
20.24%
jan 1, 2006
17.344 bln
+2.918 bln
20.23%
jan 1, 2007
19.002 bln
+1.658 bln
9.56%
jan 1, 2008
22.96 bln
+3.958 bln
20.83%
jan 1, 2009
31.533 bln
+8.573 bln
37.34%
jan 1, 2010
27.853 bln
-3.68 bln
-11.67%
jan 1, 2011
27.317 bln
-535.747 mln
-1.92%
jan 1, 2012
29.626 bln
+2.309 bln
8.45%
jan 1, 2013
31.125 bln
+1.499 bln
5.06%
jan 1, 2014
31.536 bln
+410.735 mln
1.32%
jan 1, 2015
30.539 bln
-997.376 mln
-3.16%
jan 1, 2016
25.769 bln
-4.77 bln
-15.62%
Ranking of countries by current statistics by years


Comments: