29
/
en
AIzaSyAYiBZKx7MnpbEhh9jyipgxe19OcubqV5w
April 1, 2024
148599
Guyana
GUY
true
2
1
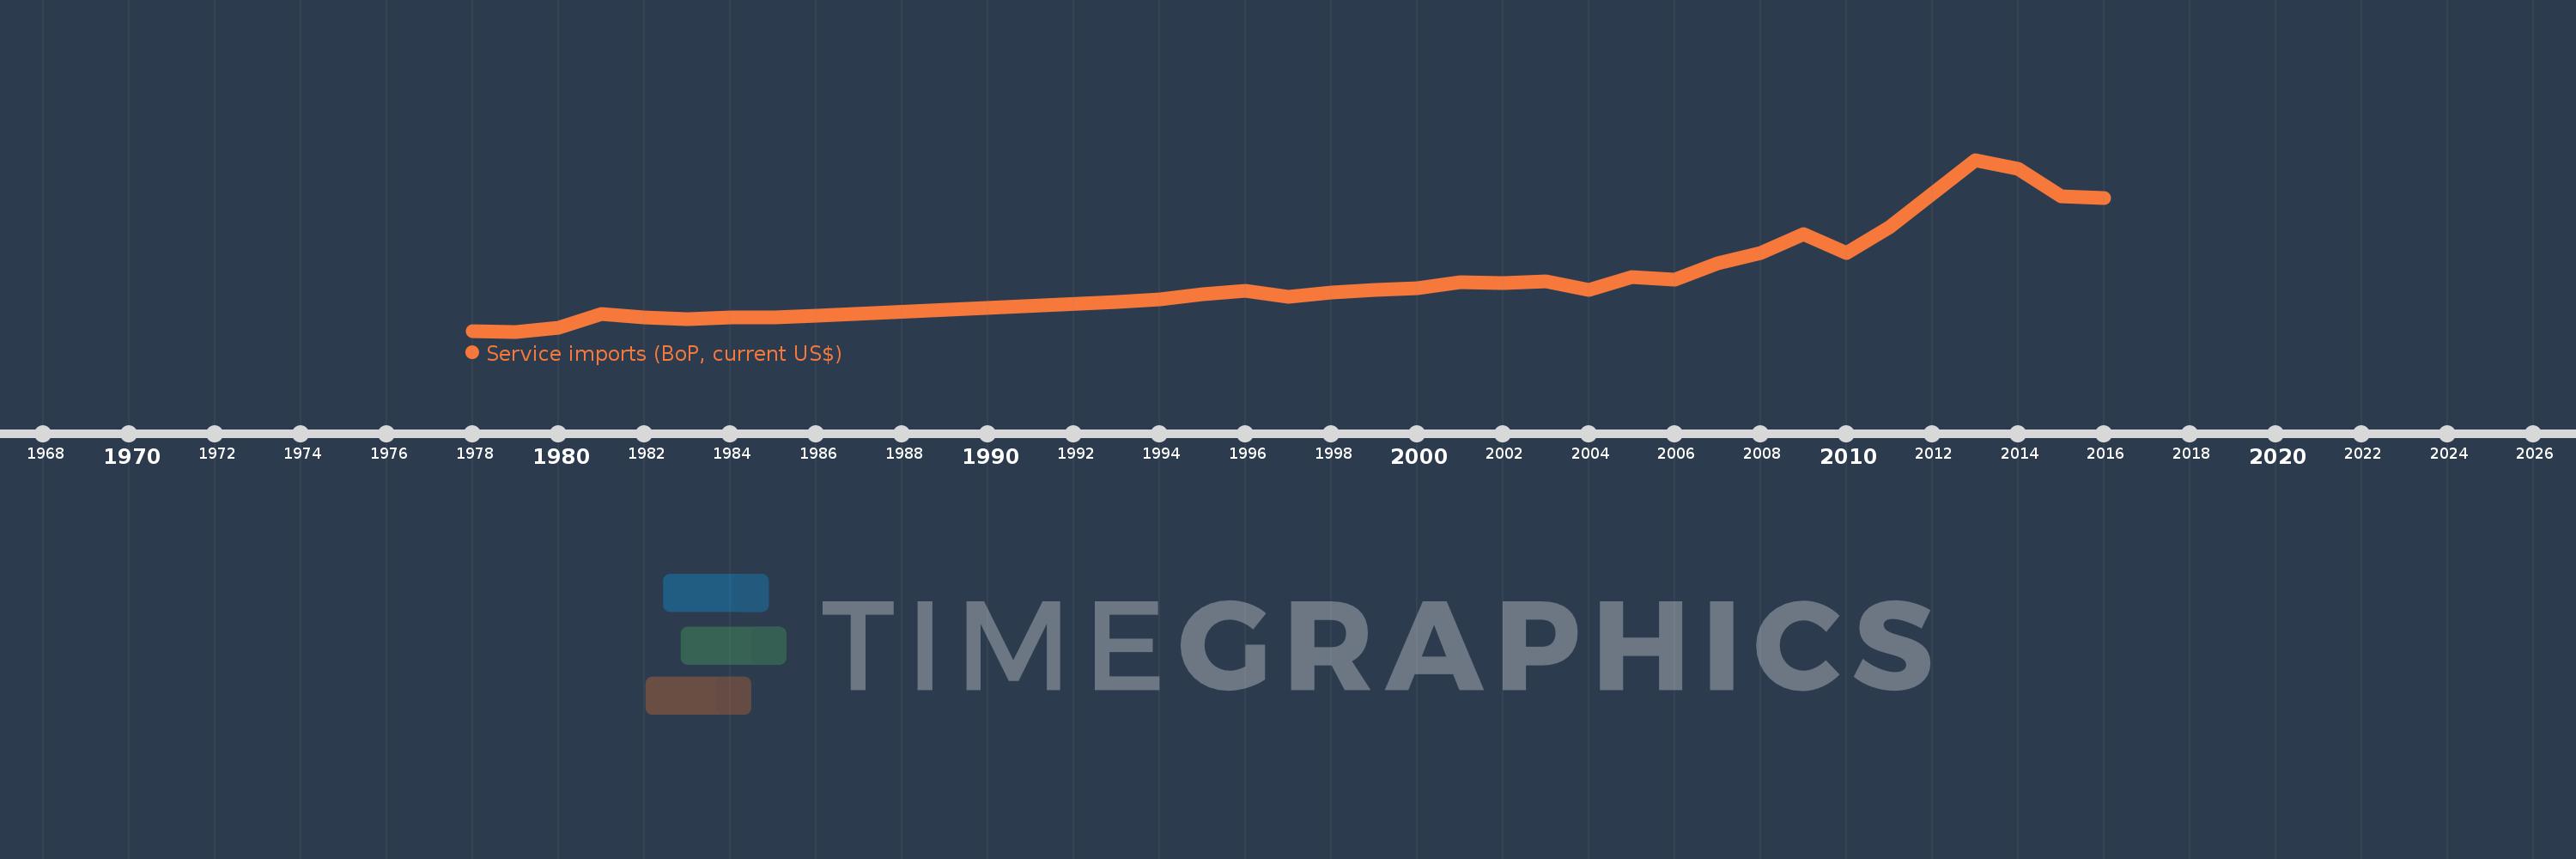
Service imports (BoP, current US$)
2016,2015,2014,2013,2012,2011,2010,2009,2008,2007,2006,2005,2004,2003,2002,2001,2000,1999,1998,1997,1996,1995,1994,1993,1986,1985,1984,1983,1982,1981,1980,1979,1978
This statistics in other country:
AfghanistanAlbaniaAlgeriaAngolaAntigua and BarbudaArab WorldArgentinaArmeniaArubaAustraliaAustriaAzerbaijanBahamas, TheBahrainBangladeshBarbadosBelarusBelgiumBelizeBeninBermudaBhutanBoliviaBosnia and HerzegovinaBotswanaBrazilBrunei DarussalamBulgariaBurkina FasoBurundiCabo VerdeCambodiaCameroonCanadaCaribbean small statesCentral African RepublicCentral Europe and the BalticsChadChileChinaColombiaComorosCongo, Dem. Rep.Congo, Rep.Costa RicaCote d'IvoireCroatiaCuracaoCyprusCzech RepublicDenmarkDjiboutiDominicaDominican RepublicEarly-demographic dividendEast Asia & PacificEast Asia & Pacific (excluding high income)East Asia & Pacific (IDA & IBRD countries)EcuadorEgypt, Arab Rep.El SalvadorEquatorial GuineaEritreaEstoniaEthiopiaEuro areaEurope & Central AsiaEurope & Central Asia (excluding high income)Europe & Central Asia (IDA & IBRD countries)European UnionFaroe IslandsFijiFinlandFragile and conflict affected situationsFranceFrench PolynesiaGabonGambia, TheGeorgiaGermanyGhanaGreeceGrenadaGuatemalaGuineaGuinea-BissauGuyanaHaitiHeavily indebted poor countries (HIPC)High incomeHondurasHong Kong SAR, ChinaHungaryIBRD onlyIcelandIDA & IBRD totalIDA blendIDA onlyIDA totalIndiaIndonesiaIran, Islamic Rep.IraqIrelandIsraelItalyJamaicaJapanJordanKazakhstanKenyaKiribatiKorea, Rep.KosovoKuwaitKyrgyz RepublicLao PDRLate-demographic dividendLatin America & Caribbean Latin America & Caribbean (excluding high income)Latin America & the Caribbean (IDA & IBRD countries)LatviaLeast developed countries: UN classificationLebanonLesothoLiberiaLibyaLithuaniaLow & middle incomeLow incomeLower middle incomeLuxembourgMacao SAR, ChinaMacedonia, FYRMadagascarMalawiMalaysiaMaldivesMaliMaltaMarshall IslandsMauritaniaMauritiusMexicoMicronesia, Fed. Sts.Middle East & North Africa (excluding high income)Middle East & North Africa (IDA & IBRD countries)Middle incomeMoldovaMongoliaMontenegroMoroccoMozambiqueMyanmarNamibiaNepalNetherlandsNew CaledoniaNew ZealandNicaraguaNigerNigeriaNorth AmericaNorwayOECD membersOmanOther small statesPacific island small statesPakistanPalauPanamaPapua New GuineaParaguayPeruPhilippinesPolandPortugalPost-demographic dividendPre-demographic dividendQatarRomaniaRussian FederationRwandaSamoaSao Tome and PrincipeSaudi ArabiaSenegalSerbiaSeychellesSierra LeoneSingaporeSint Maarten (Dutch part)Slovak RepublicSloveniaSmall statesSolomon IslandsSouth AfricaSouth AsiaSouth Asia (IDA & IBRD)South SudanSpainSri LankaSt. Kitts and NevisSt. LuciaSt. Vincent and the GrenadinesSub-Saharan Africa Sub-Saharan Africa (excluding high income)Sub-Saharan Africa (IDA & IBRD countries)SudanSurinameSwazilandSwedenSwitzerlandSyrian Arab RepublicTajikistanTanzaniaThailandTimor-LesteTogoTongaTrinidad and TobagoTunisiaTurkeyTuvaluUgandaUkraineUnited KingdomUnited StatesUpper middle incomeUruguayVanuatuVenezuela, RBVietnamWest Bank and GazaWorldYemen, Rep.ZambiaZimbabwe Timeline:
This timeline shows a graph from 1978 to 2016 of Guyana. No data until 1977. Number of actual observations by date: 33.
Source name:
World Development Indicators
Source organization:
International Monetary Fund, Balance of Payments Statistics Yearbook and data files.
Categories, topics:
Economy & Growth, Trade
Last updated:
apr 23, 2017
Indicators value changes by year
Minimum:
60.078 mln
jan 1, 1979
Maximum:
526.341 mln
jan 1, 2013
At the date of observation
Value
Absolute change
Change from previous value
jan 1, 1978
60.745 mln
+60.745 mln
0.0%
jan 1, 1979
60.078 mln
-666.667K
-1.1%
jan 1, 1980
71.373 mln
+11.294 mln
18.8%
jan 1, 1981
107.333 mln
+35.961 mln
50.38%
jan 1, 1982
98.88 mln
-8.453 mln
-7.88%
jan 1, 1983
94.467 mln
-4.413 mln
-4.46%
jan 1, 1984
98.133 mln
+3.667 mln
3.88%
jan 1, 1985
99.046 mln
+912.185K
0.93%
jan 1, 1986
104.025 mln
+4.98 mln
5.03%
jan 1, 1993
139.82 mln
+35.795 mln
34.41%
jan 1, 1994
148.1 mln
+8.28 mln
5.92%
jan 1, 1995
160.87 mln
+12.77 mln
8.62%
jan 1, 1996
171.83 mln
+10.96 mln
6.81%
jan 1, 1997
153.8 mln
-18.03 mln
-10.49%
jan 1, 1998
165.0 mln
+11.2 mln
7.28%
jan 1, 1999
173.9 mln
+8.9 mln
5.39%
jan 1, 2000
178.1 mln
+4.2 mln
2.42%
jan 1, 2001
193.2 mln
+15.1 mln
8.48%
jan 1, 2002
192.4 mln
-800.0K
-0.41%
jan 1, 2003
195.8 mln
+3.4 mln
1.77%
jan 1, 2004
172.1 mln
-23.7 mln
-12.1%
jan 1, 2005
207.588 mln
+35.488 mln
20.62%
jan 1, 2006
200.891 mln
-6.697 mln
-3.23%
jan 1, 2007
245.417 mln
+44.526 mln
22.16%
jan 1, 2008
272.539 mln
+27.122 mln
11.05%
jan 1, 2009
325.193 mln
+52.654 mln
19.32%
jan 1, 2010
272.421 mln
-52.772 mln
-16.23%
jan 1, 2011
343.839 mln
+71.418 mln
26.22%
jan 1, 2012
433.752 mln
+89.913 mln
26.15%
jan 1, 2013
526.341 mln
+92.589 mln
21.35%
jan 1, 2014
502.692 mln
-23.649 mln
-4.49%
jan 1, 2015
426.215 mln
-76.477 mln
-15.21%
jan 1, 2016
423.359 mln
-2.856 mln
-0.67%
Ranking of countries by current statistics by years


Comments: