29
/
en
AIzaSyAYiBZKx7MnpbEhh9jyipgxe19OcubqV5w
April 1, 2024
252481
St. Vincent and the Grenadines
VCT
true
2
1
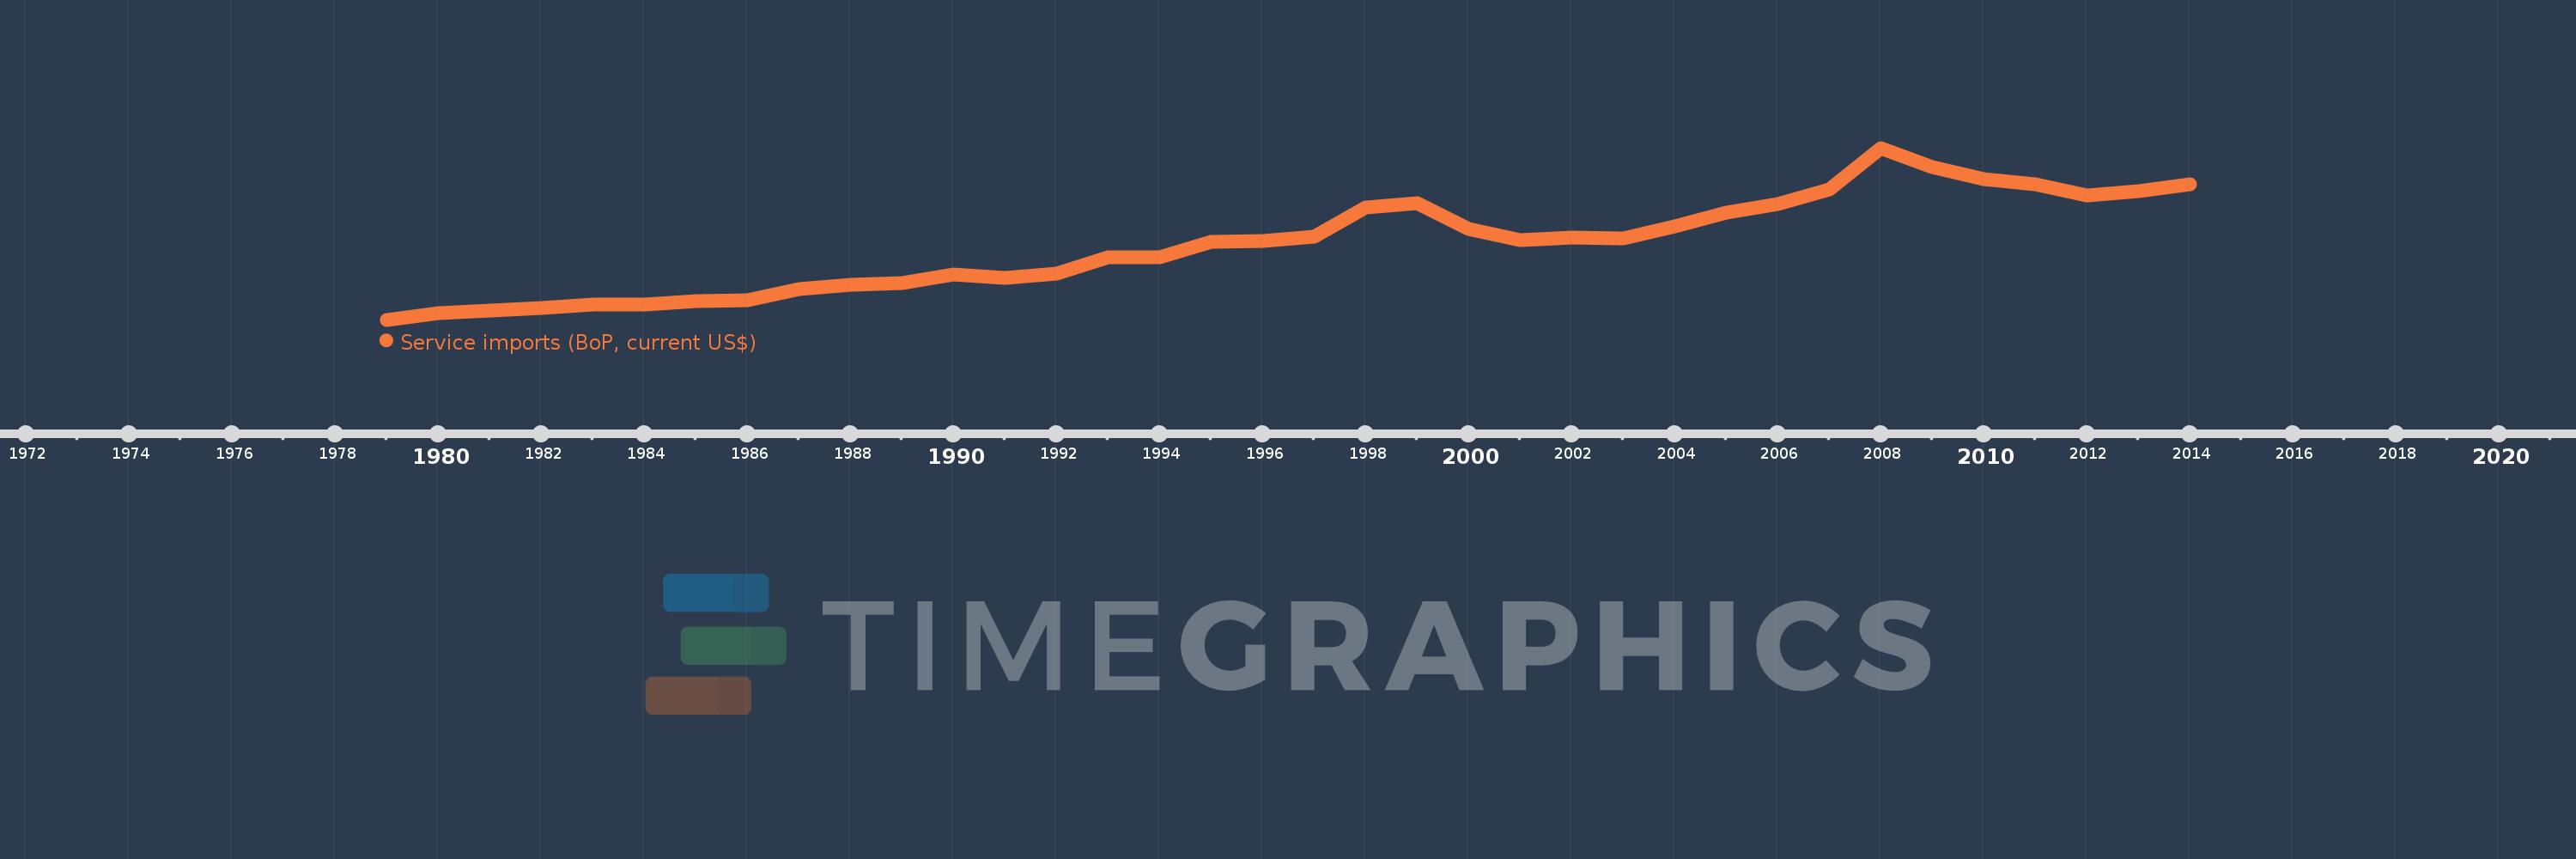
Service imports (BoP, current US$)
2014,2013,2012,2011,2010,2009,2008,2007,2006,2005,2004,2003,2002,2001,2000,1999,1998,1997,1996,1995,1994,1993,1992,1991,1990,1989,1988,1987,1986,1985,1984,1983,1982,1981,1980,1979
This statistics in other country:
AfghanistanAlbaniaAlgeriaAngolaAntigua and BarbudaArab WorldArgentinaArmeniaArubaAustraliaAustriaAzerbaijanBahamas, TheBahrainBangladeshBarbadosBelarusBelgiumBelizeBeninBermudaBhutanBoliviaBosnia and HerzegovinaBotswanaBrazilBrunei DarussalamBulgariaBurkina FasoBurundiCabo VerdeCambodiaCameroonCanadaCaribbean small statesCentral African RepublicCentral Europe and the BalticsChadChileChinaColombiaComorosCongo, Dem. Rep.Congo, Rep.Costa RicaCote d'IvoireCroatiaCuracaoCyprusCzech RepublicDenmarkDjiboutiDominicaDominican RepublicEarly-demographic dividendEast Asia & PacificEast Asia & Pacific (excluding high income)East Asia & Pacific (IDA & IBRD countries)EcuadorEgypt, Arab Rep.El SalvadorEquatorial GuineaEritreaEstoniaEthiopiaEuro areaEurope & Central AsiaEurope & Central Asia (excluding high income)Europe & Central Asia (IDA & IBRD countries)European UnionFaroe IslandsFijiFinlandFragile and conflict affected situationsFranceFrench PolynesiaGabonGambia, TheGeorgiaGermanyGhanaGreeceGrenadaGuatemalaGuineaGuinea-BissauGuyanaHaitiHeavily indebted poor countries (HIPC)High incomeHondurasHong Kong SAR, ChinaHungaryIBRD onlyIcelandIDA & IBRD totalIDA blendIDA onlyIDA totalIndiaIndonesiaIran, Islamic Rep.IraqIrelandIsraelItalyJamaicaJapanJordanKazakhstanKenyaKiribatiKorea, Rep.KosovoKuwaitKyrgyz RepublicLao PDRLate-demographic dividendLatin America & Caribbean Latin America & Caribbean (excluding high income)Latin America & the Caribbean (IDA & IBRD countries)LatviaLeast developed countries: UN classificationLebanonLesothoLiberiaLibyaLithuaniaLow & middle incomeLow incomeLower middle incomeLuxembourgMacao SAR, ChinaMacedonia, FYRMadagascarMalawiMalaysiaMaldivesMaliMaltaMarshall IslandsMauritaniaMauritiusMexicoMicronesia, Fed. Sts.Middle East & North Africa (excluding high income)Middle East & North Africa (IDA & IBRD countries)Middle incomeMoldovaMongoliaMontenegroMoroccoMozambiqueMyanmarNamibiaNepalNetherlandsNew CaledoniaNew ZealandNicaraguaNigerNigeriaNorth AmericaNorwayOECD membersOmanOther small statesPacific island small statesPakistanPalauPanamaPapua New GuineaParaguayPeruPhilippinesPolandPortugalPost-demographic dividendPre-demographic dividendQatarRomaniaRussian FederationRwandaSamoaSao Tome and PrincipeSaudi ArabiaSenegalSerbiaSeychellesSierra LeoneSingaporeSint Maarten (Dutch part)Slovak RepublicSloveniaSmall statesSolomon IslandsSouth AfricaSouth AsiaSouth Asia (IDA & IBRD)South SudanSpainSri LankaSt. Kitts and NevisSt. LuciaSt. Vincent and the GrenadinesSub-Saharan Africa Sub-Saharan Africa (excluding high income)Sub-Saharan Africa (IDA & IBRD countries)SudanSurinameSwazilandSwedenSwitzerlandSyrian Arab RepublicTajikistanTanzaniaThailandTimor-LesteTogoTongaTrinidad and TobagoTunisiaTurkeyTuvaluUgandaUkraineUnited KingdomUnited StatesUpper middle incomeUruguayVanuatuVenezuela, RBVietnamWest Bank and GazaWorldYemen, Rep.ZambiaZimbabwe Timeline:
This timeline shows a graph from 1979 to 2014 of St. Vincent and the Grenadines. No data until 1978. Number of actual observations by date: 36.
Source name:
World Development Indicators
Source organization:
International Monetary Fund, Balance of Payments Statistics Yearbook and data files.
Categories, topics:
Economy & Growth, Trade
Last updated:
apr 23, 2017
Indicators value changes by year
Minimum:
5.589 mln
jan 1, 1979
Maximum:
114.205 mln
jan 1, 2008
At the date of observation
Value
Absolute change
Change from previous value
jan 1, 1979
5.589 mln
+5.589 mln
0.0%
jan 1, 1980
9.807 mln
+4.219 mln
75.48%
jan 1, 1981
11.389 mln
+1.581 mln
16.13%
jan 1, 1982
13.289 mln
+1.9 mln
16.68%
jan 1, 1983
15.011 mln
+1.722 mln
12.96%
jan 1, 1984
15.241 mln
+229.63K
1.53%
jan 1, 1985
17.259 mln
+2.019 mln
13.24%
jan 1, 1986
17.919 mln
+659.259K
3.82%
jan 1, 1987
25.189 mln
+7.27 mln
40.57%
jan 1, 1988
27.474 mln
+2.285 mln
9.07%
jan 1, 1989
28.693 mln
+1.219 mln
4.44%
jan 1, 1990
34.052 mln
+5.359 mln
18.68%
jan 1, 1991
31.859 mln
-2.193 mln
-6.44%
jan 1, 1992
34.519 mln
+2.659 mln
8.35%
jan 1, 1993
44.819 mln
+10.3 mln
29.84%
jan 1, 1994
44.807 mln
-11.111K
-0.02%
jan 1, 1995
54.637 mln
+9.83 mln
21.94%
jan 1, 1996
55.144 mln
+507.407K
0.93%
jan 1, 1997
58.219 mln
+3.074 mln
5.57%
jan 1, 1998
76.333 mln
+18.115 mln
31.12%
jan 1, 1999
79.056 mln
+2.722 mln
3.57%
jan 1, 2000
62.919 mln
-16.137 mln
-20.41%
jan 1, 2001
56.115 mln
-6.804 mln
-10.81%
jan 1, 2002
57.489 mln
+1.374 mln
2.45%
jan 1, 2003
57.051 mln
-437.778K
-0.76%
jan 1, 2004
64.588 mln
+7.537 mln
13.21%
jan 1, 2005
73.221 mln
+8.633 mln
13.37%
jan 1, 2006
78.803 mln
+5.581 mln
7.62%
jan 1, 2007
88.171 mln
+9.369 mln
11.89%
jan 1, 2008
114.205 mln
+26.033 mln
29.53%
jan 1, 2009
102.138 mln
-12.067 mln
-10.57%
jan 1, 2010
94.235 mln
-7.903 mln
-7.74%
jan 1, 2011
91.46 mln
-2.775 mln
-2.95%
jan 1, 2012
84.335 mln
-7.125 mln
-7.79%
jan 1, 2013
87.078 mln
+2.743 mln
3.25%
jan 1, 2014
91.355 mln
+4.277 mln
4.91%
Ranking of countries by current statistics by years


Comments: