29
/
en
AIzaSyAYiBZKx7MnpbEhh9jyipgxe19OcubqV5w
April 1, 2024
196275
Mexico
MEX
true
2
1
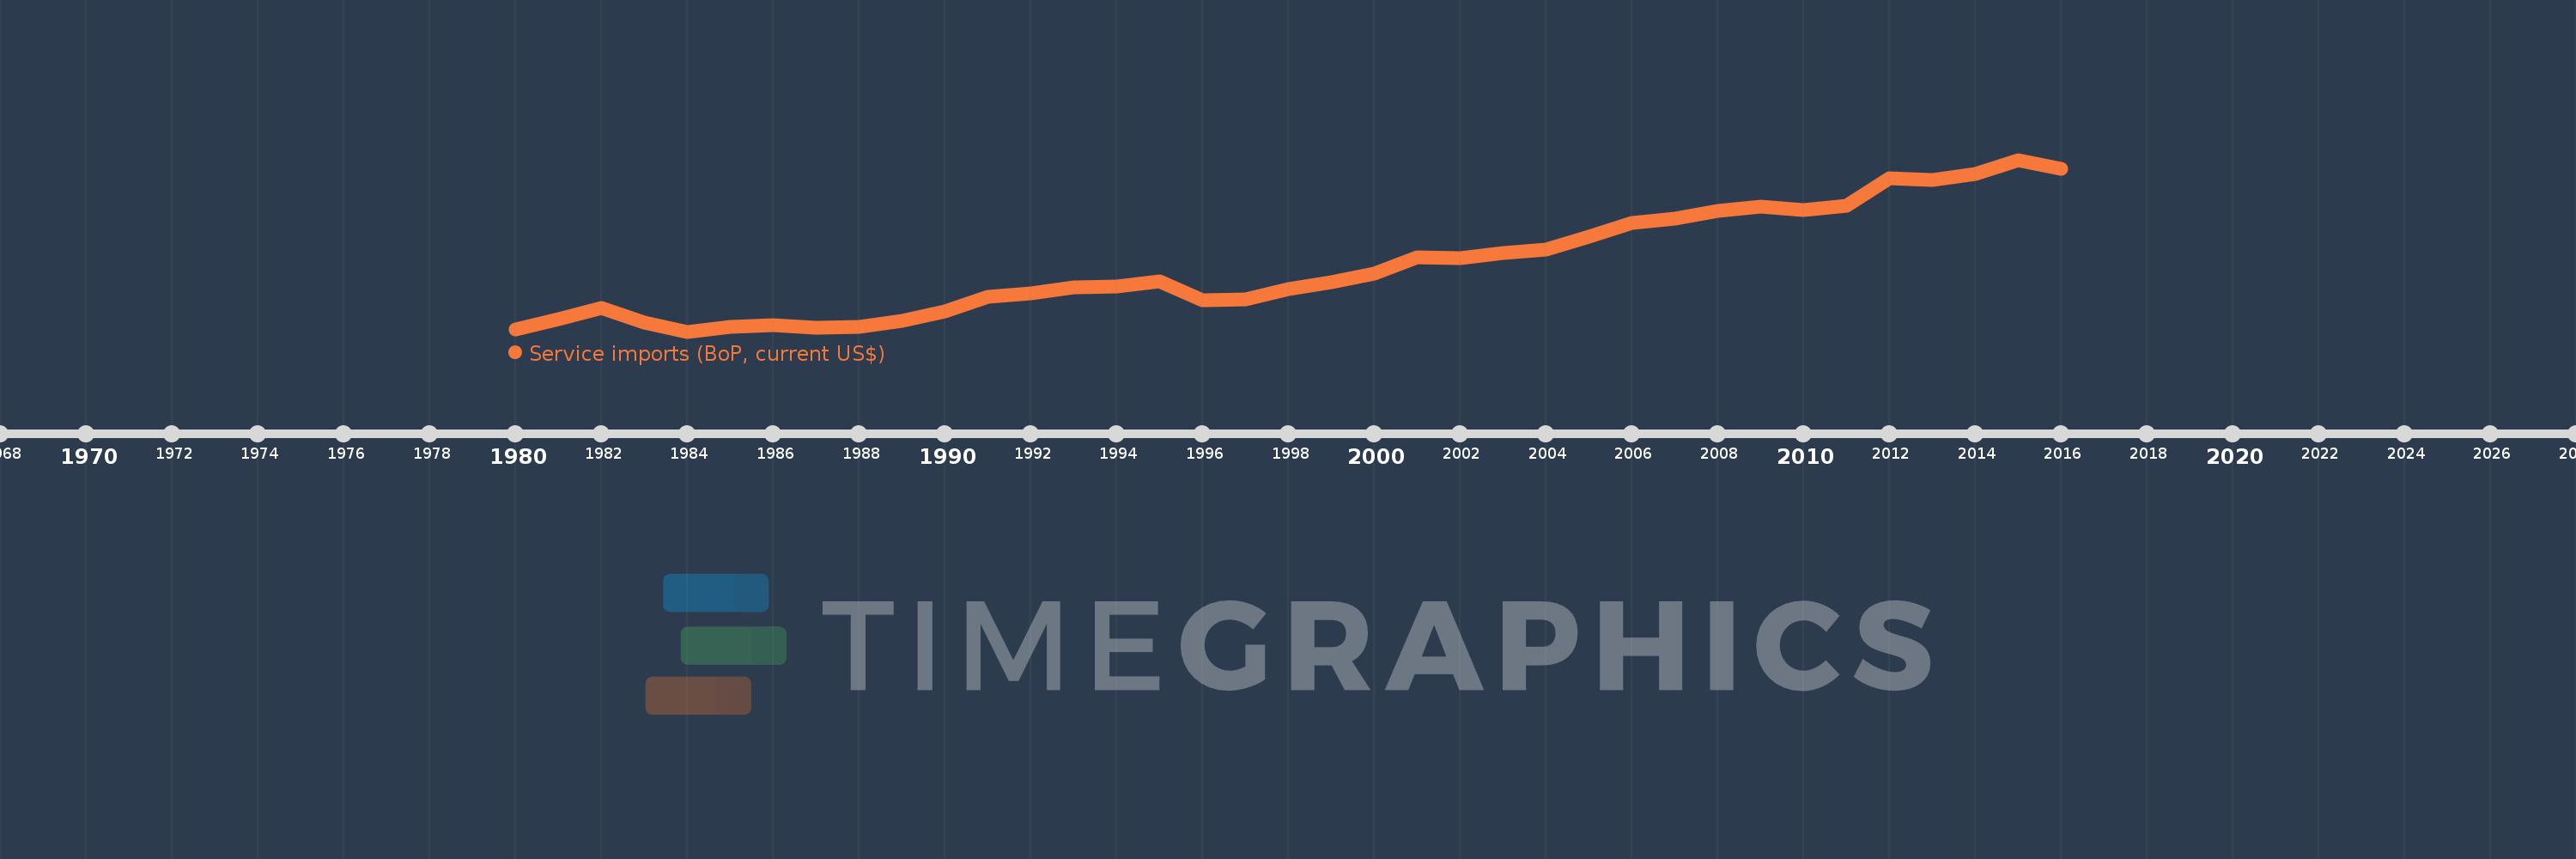
Service imports (BoP, current US$)
2016,2015,2014,2013,2012,2011,2010,2009,2008,2007,2006,2005,2004,2003,2002,2001,2000,1999,1998,1997,1996,1995,1994,1993,1992,1991,1990,1989,1988,1987,1986,1985,1984,1983,1982,1981,1980
This statistics in other country:
AfghanistanAlbaniaAlgeriaAngolaAntigua and BarbudaArab WorldArgentinaArmeniaArubaAustraliaAustriaAzerbaijanBahamas, TheBahrainBangladeshBarbadosBelarusBelgiumBelizeBeninBermudaBhutanBoliviaBosnia and HerzegovinaBotswanaBrazilBrunei DarussalamBulgariaBurkina FasoBurundiCabo VerdeCambodiaCameroonCanadaCaribbean small statesCentral African RepublicCentral Europe and the BalticsChadChileChinaColombiaComorosCongo, Dem. Rep.Congo, Rep.Costa RicaCote d'IvoireCroatiaCuracaoCyprusCzech RepublicDenmarkDjiboutiDominicaDominican RepublicEarly-demographic dividendEast Asia & PacificEast Asia & Pacific (excluding high income)East Asia & Pacific (IDA & IBRD countries)EcuadorEgypt, Arab Rep.El SalvadorEquatorial GuineaEritreaEstoniaEthiopiaEuro areaEurope & Central AsiaEurope & Central Asia (excluding high income)Europe & Central Asia (IDA & IBRD countries)European UnionFaroe IslandsFijiFinlandFragile and conflict affected situationsFranceFrench PolynesiaGabonGambia, TheGeorgiaGermanyGhanaGreeceGrenadaGuatemalaGuineaGuinea-BissauGuyanaHaitiHeavily indebted poor countries (HIPC)High incomeHondurasHong Kong SAR, ChinaHungaryIBRD onlyIcelandIDA & IBRD totalIDA blendIDA onlyIDA totalIndiaIndonesiaIran, Islamic Rep.IraqIrelandIsraelItalyJamaicaJapanJordanKazakhstanKenyaKiribatiKorea, Rep.KosovoKuwaitKyrgyz RepublicLao PDRLate-demographic dividendLatin America & Caribbean Latin America & Caribbean (excluding high income)Latin America & the Caribbean (IDA & IBRD countries)LatviaLeast developed countries: UN classificationLebanonLesothoLiberiaLibyaLithuaniaLow & middle incomeLow incomeLower middle incomeLuxembourgMacao SAR, ChinaMacedonia, FYRMadagascarMalawiMalaysiaMaldivesMaliMaltaMarshall IslandsMauritaniaMauritiusMexicoMicronesia, Fed. Sts.Middle East & North Africa (excluding high income)Middle East & North Africa (IDA & IBRD countries)Middle incomeMoldovaMongoliaMontenegroMoroccoMozambiqueMyanmarNamibiaNepalNetherlandsNew CaledoniaNew ZealandNicaraguaNigerNigeriaNorth AmericaNorwayOECD membersOmanOther small statesPacific island small statesPakistanPalauPanamaPapua New GuineaParaguayPeruPhilippinesPolandPortugalPost-demographic dividendPre-demographic dividendQatarRomaniaRussian FederationRwandaSamoaSao Tome and PrincipeSaudi ArabiaSenegalSerbiaSeychellesSierra LeoneSingaporeSint Maarten (Dutch part)Slovak RepublicSloveniaSmall statesSolomon IslandsSouth AfricaSouth AsiaSouth Asia (IDA & IBRD)South SudanSpainSri LankaSt. Kitts and NevisSt. LuciaSt. Vincent and the GrenadinesSub-Saharan Africa Sub-Saharan Africa (excluding high income)Sub-Saharan Africa (IDA & IBRD countries)SudanSurinameSwazilandSwedenSwitzerlandSyrian Arab RepublicTajikistanTanzaniaThailandTimor-LesteTogoTongaTrinidad and TobagoTunisiaTurkeyTuvaluUgandaUkraineUnited KingdomUnited StatesUpper middle incomeUruguayVanuatuVenezuela, RBVietnamWest Bank and GazaWorldYemen, Rep.ZambiaZimbabwe Timeline:
This timeline shows a graph from 1980 to 2016 of Mexico. No data until 1979. Number of actual observations by date: 37.
Source name:
World Development Indicators
Source organization:
International Monetary Fund, Balance of Payments Statistics Yearbook and data files.
Categories, topics:
Economy & Growth, Trade
Last updated:
apr 23, 2017
Indicators value changes by year
Minimum:
4.477 bln
jan 1, 1984
Maximum:
33.537 bln
jan 1, 2015
At the date of observation
Value
Absolute change
Change from previous value
jan 1, 1980
4.901 bln
+4.901 bln
0.0%
jan 1, 1981
6.514 bln
+1.613 bln
32.91%
jan 1, 1982
8.489 bln
+1.975 bln
30.32%
jan 1, 1983
6.066 bln
-2.423 bln
-28.54%
jan 1, 1984
4.477 bln
-1.589 bln
-26.2%
jan 1, 1985
5.235 bln
+758.0 mln
16.93%
jan 1, 1986
5.524 bln
+289.0 mln
5.52%
jan 1, 1987
5.194 bln
-330.0 mln
-5.97%
jan 1, 1988
5.31 bln
+116.0 mln
2.23%
jan 1, 1989
6.281 bln
+971.0 mln
18.29%
jan 1, 1990
7.88 bln
+1.599 bln
25.46%
jan 1, 1991
10.323 bln
+2.443 bln
31.0%
jan 1, 1992
10.959 bln
+636.0 mln
6.16%
jan 1, 1993
11.959 bln
+1000.0 mln
9.12%
jan 1, 1994
12.046 bln
+87.0 mln
0.73%
jan 1, 1995
13.043 bln
+996.61 mln
8.27%
jan 1, 1996
9.715 bln
-3.327 bln
-25.51%
jan 1, 1997
9.971 bln
+255.613 mln
2.63%
jan 1, 1998
11.651 bln
+1.68 bln
16.85%
jan 1, 1999
12.843 bln
+1.192 bln
10.23%
jan 1, 2000
14.295 bln
+1.452 bln
11.31%
jan 1, 2001
17.057 bln
+2.762 bln
19.32%
jan 1, 2002
16.929 bln
-127.481 mln
-0.75%
jan 1, 2003
17.809 bln
+879.917 mln
5.2%
jan 1, 2004
18.298 bln
+488.67 mln
2.74%
jan 1, 2005
20.547 bln
+2.249 bln
12.29%
jan 1, 2006
22.804 bln
+2.257 bln
10.99%
jan 1, 2007
23.641 bln
+836.953 mln
3.67%
jan 1, 2008
24.904 bln
+1.263 bln
5.34%
jan 1, 2009
25.649 bln
+744.624 mln
2.99%
jan 1, 2010
25.043 bln
-606.429 mln
-2.36%
jan 1, 2011
25.792 bln
+749.322 mln
2.99%
jan 1, 2012
30.375 bln
+4.583 bln
17.77%
jan 1, 2013
30.15 bln
-224.716 mln
-0.74%
jan 1, 2014
31.177 bln
+1.027 bln
3.41%
jan 1, 2015
33.537 bln
+2.36 bln
7.57%
jan 1, 2016
32.057 bln
-1.48 bln
-4.41%
Ranking of countries by current statistics by years


Comments: