29
/
en
AIzaSyAYiBZKx7MnpbEhh9jyipgxe19OcubqV5w
April 1, 2024
193677
Mauritania
MRT
true
2
1
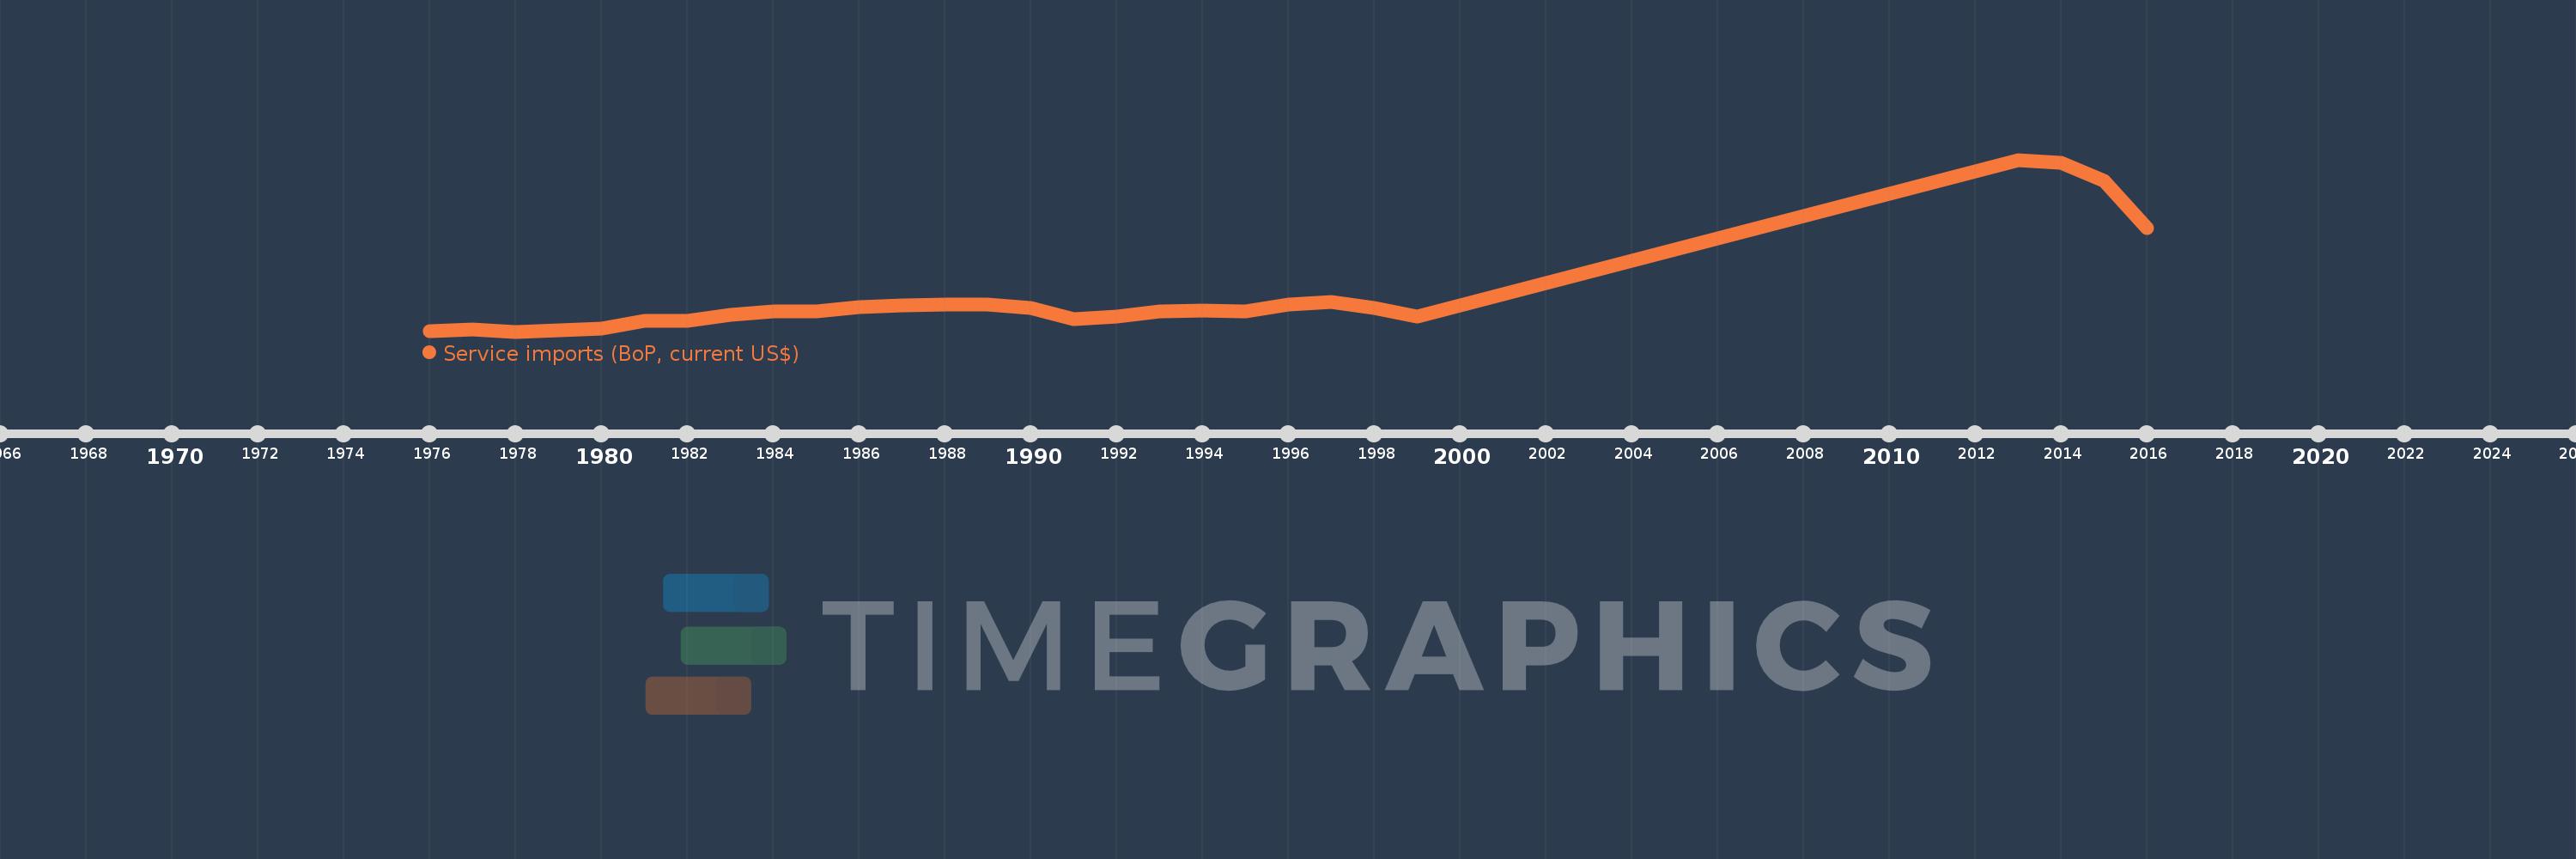
Service imports (BoP, current US$)
2016,2015,2014,2013,1999,1998,1997,1996,1995,1994,1993,1992,1991,1990,1989,1988,1987,1986,1985,1984,1983,1982,1981,1980,1979,1978,1977,1976
This statistics in other country:
AfghanistanAlbaniaAlgeriaAngolaAntigua and BarbudaArab WorldArgentinaArmeniaArubaAustraliaAustriaAzerbaijanBahamas, TheBahrainBangladeshBarbadosBelarusBelgiumBelizeBeninBermudaBhutanBoliviaBosnia and HerzegovinaBotswanaBrazilBrunei DarussalamBulgariaBurkina FasoBurundiCabo VerdeCambodiaCameroonCanadaCaribbean small statesCentral African RepublicCentral Europe and the BalticsChadChileChinaColombiaComorosCongo, Dem. Rep.Congo, Rep.Costa RicaCote d'IvoireCroatiaCuracaoCyprusCzech RepublicDenmarkDjiboutiDominicaDominican RepublicEarly-demographic dividendEast Asia & PacificEast Asia & Pacific (excluding high income)East Asia & Pacific (IDA & IBRD countries)EcuadorEgypt, Arab Rep.El SalvadorEquatorial GuineaEritreaEstoniaEthiopiaEuro areaEurope & Central AsiaEurope & Central Asia (excluding high income)Europe & Central Asia (IDA & IBRD countries)European UnionFaroe IslandsFijiFinlandFragile and conflict affected situationsFranceFrench PolynesiaGabonGambia, TheGeorgiaGermanyGhanaGreeceGrenadaGuatemalaGuineaGuinea-BissauGuyanaHaitiHeavily indebted poor countries (HIPC)High incomeHondurasHong Kong SAR, ChinaHungaryIBRD onlyIcelandIDA & IBRD totalIDA blendIDA onlyIDA totalIndiaIndonesiaIran, Islamic Rep.IraqIrelandIsraelItalyJamaicaJapanJordanKazakhstanKenyaKiribatiKorea, Rep.KosovoKuwaitKyrgyz RepublicLao PDRLate-demographic dividendLatin America & Caribbean Latin America & Caribbean (excluding high income)Latin America & the Caribbean (IDA & IBRD countries)LatviaLeast developed countries: UN classificationLebanonLesothoLiberiaLibyaLithuaniaLow & middle incomeLow incomeLower middle incomeLuxembourgMacao SAR, ChinaMacedonia, FYRMadagascarMalawiMalaysiaMaldivesMaliMaltaMarshall IslandsMauritaniaMauritiusMexicoMicronesia, Fed. Sts.Middle East & North Africa (excluding high income)Middle East & North Africa (IDA & IBRD countries)Middle incomeMoldovaMongoliaMontenegroMoroccoMozambiqueMyanmarNamibiaNepalNetherlandsNew CaledoniaNew ZealandNicaraguaNigerNigeriaNorth AmericaNorwayOECD membersOmanOther small statesPacific island small statesPakistanPalauPanamaPapua New GuineaParaguayPeruPhilippinesPolandPortugalPost-demographic dividendPre-demographic dividendQatarRomaniaRussian FederationRwandaSamoaSao Tome and PrincipeSaudi ArabiaSenegalSerbiaSeychellesSierra LeoneSingaporeSint Maarten (Dutch part)Slovak RepublicSloveniaSmall statesSolomon IslandsSouth AfricaSouth AsiaSouth Asia (IDA & IBRD)South SudanSpainSri LankaSt. Kitts and NevisSt. LuciaSt. Vincent and the GrenadinesSub-Saharan Africa Sub-Saharan Africa (excluding high income)Sub-Saharan Africa (IDA & IBRD countries)SudanSurinameSwazilandSwedenSwitzerlandSyrian Arab RepublicTajikistanTanzaniaThailandTimor-LesteTogoTongaTrinidad and TobagoTunisiaTurkeyTuvaluUgandaUkraineUnited KingdomUnited StatesUpper middle incomeUruguayVanuatuVenezuela, RBVietnamWest Bank and GazaWorldYemen, Rep.ZambiaZimbabwe Timeline:
This timeline shows a graph from 1976 to 2016 of Mauritania. No data until 1975. Number of actual observations by date: 28.
Source name:
World Development Indicators
Source organization:
International Monetary Fund, Balance of Payments Statistics Yearbook and data files.
Categories, topics:
Economy & Growth, Trade
Last updated:
apr 23, 2017
Indicators value changes by year
Minimum:
67.19 mln
jan 1, 1978
Maximum:
1.017 bln
jan 1, 2013
At the date of observation
Value
Absolute change
Change from previous value
jan 1, 1976
69.181 mln
+69.181 mln
0.0%
jan 1, 1977
80.893 mln
+11.712 mln
16.93%
jan 1, 1978
67.19 mln
-13.703 mln
-16.94%
jan 1, 1979
75.256 mln
+8.066 mln
12.0%
jan 1, 1980
83.173 mln
+7.917 mln
10.52%
jan 1, 1981
127.76 mln
+44.588 mln
53.61%
jan 1, 1982
128.127 mln
+366.631K
0.29%
jan 1, 1983
157.546 mln
+29.419 mln
22.96%
jan 1, 1984
177.17 mln
+19.625 mln
12.46%
jan 1, 1985
177.781 mln
+610.37K
0.34%
jan 1, 1986
201.777 mln
+23.997 mln
13.5%
jan 1, 1987
211.146 mln
+9.369 mln
4.64%
jan 1, 1988
214.528 mln
+3.382 mln
1.6%
jan 1, 1989
217.045 mln
+2.517 mln
1.17%
jan 1, 1990
196.036 mln
-21.009 mln
-9.68%
jan 1, 1991
136.846 mln
-59.19 mln
-30.19%
jan 1, 1992
150.953 mln
+14.108 mln
10.31%
jan 1, 1993
179.071 mln
+28.118 mln
18.63%
jan 1, 1994
184.941 mln
+5.87 mln
3.28%
jan 1, 1995
181.072 mln
-3.869 mln
-2.09%
jan 1, 1996
216.987 mln
+35.914 mln
19.83%
jan 1, 1997
231.275 mln
+14.289 mln
6.59%
jan 1, 1998
199.956 mln
-31.319 mln
-13.54%
jan 1, 1999
152.534 mln
-47.422 mln
-23.72%
jan 1, 2013
1.017 bln
+864.134 mln
566.52%
jan 1, 2014
999.405 mln
-17.264 mln
-1.7%
jan 1, 2015
900.33 mln
-99.075 mln
-9.91%
jan 1, 2016
640.746 mln
-259.584 mln
-28.83%
Ranking of countries by current statistics by years


Comments: