29
/
en
AIzaSyAYiBZKx7MnpbEhh9jyipgxe19OcubqV5w
April 1, 2024
122858
Dominican Republic
DOM
true
2
1
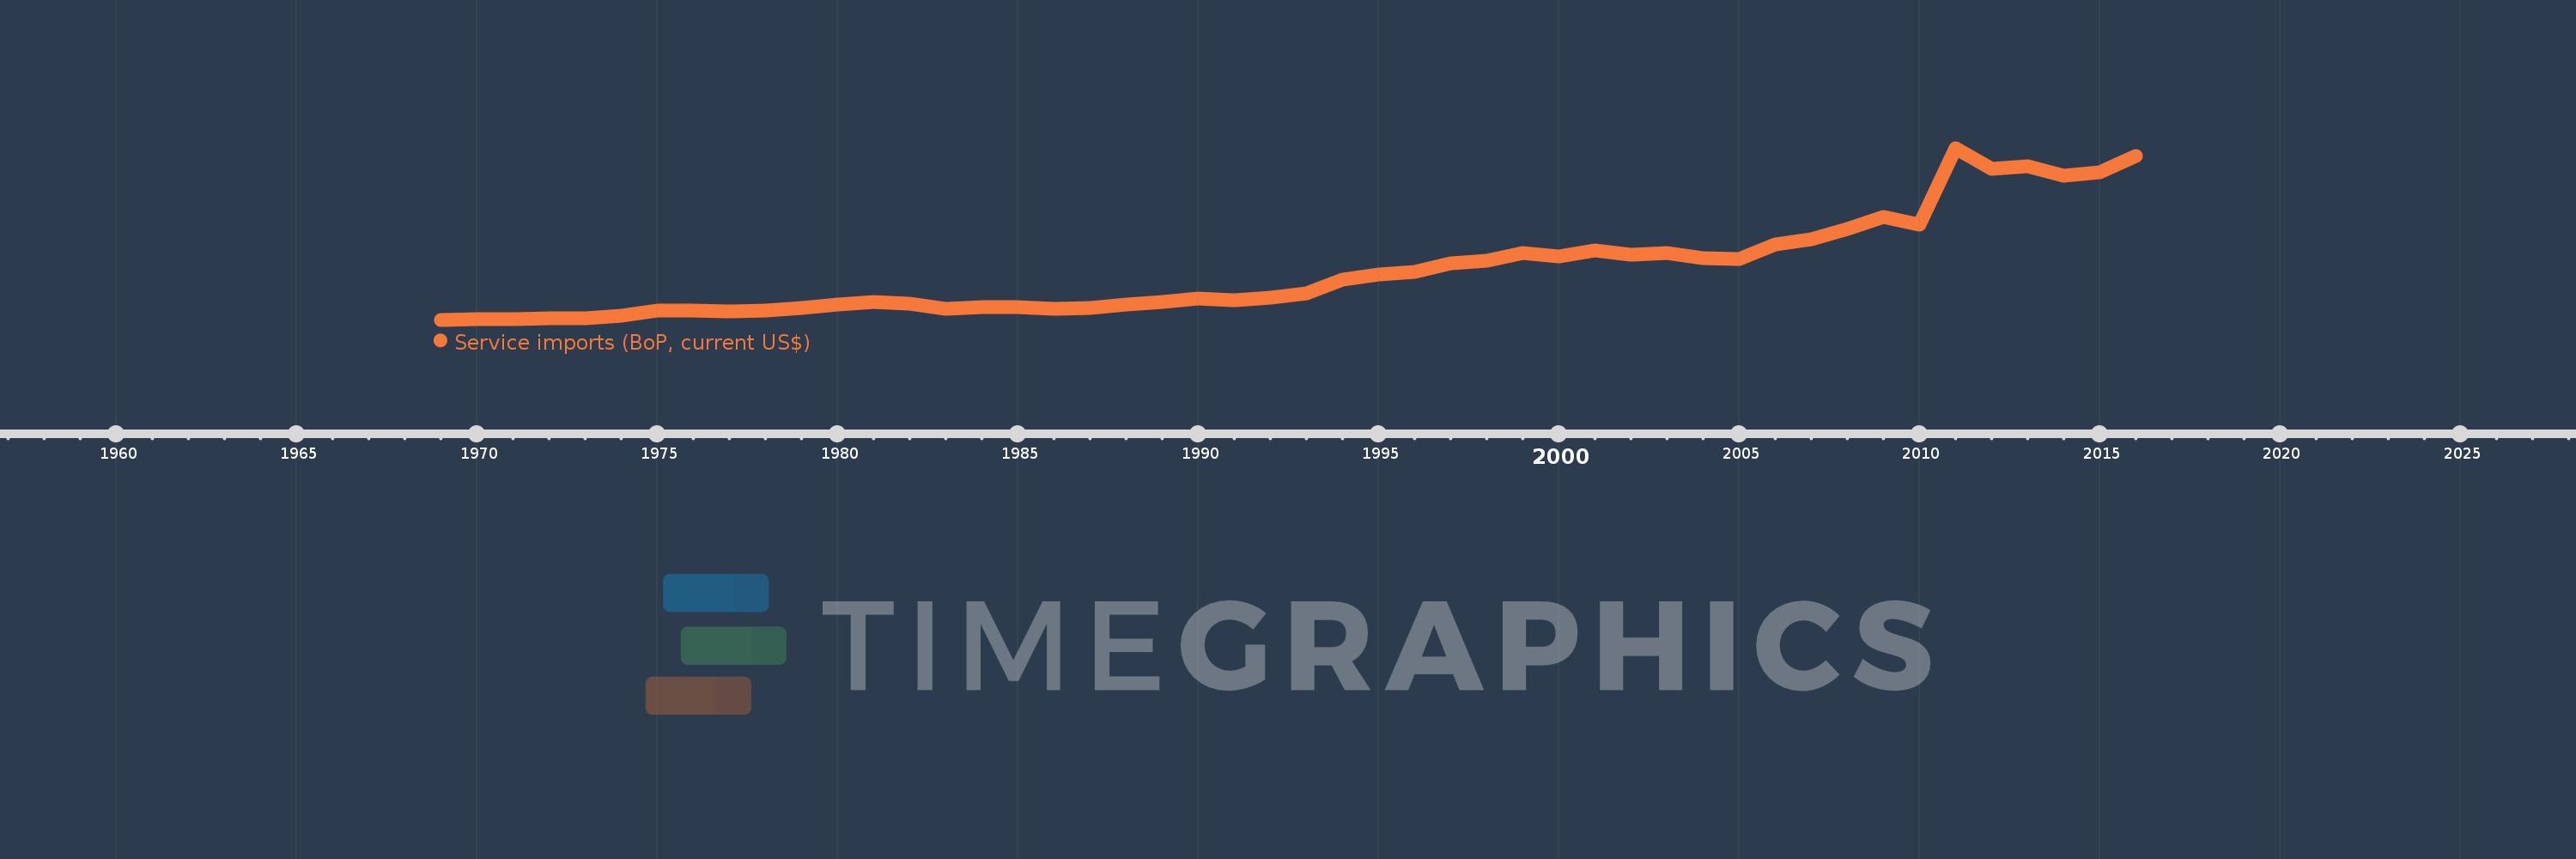
Service imports (BoP, current US$)
2016,2015,2014,2013,2012,2011,2010,2009,2008,2007,2006,2005,2004,2003,2002,2001,2000,1999,1998,1997,1996,1995,1994,1993,1992,1991,1990,1989,1988,1987,1986,1985,1984,1983,1982,1981,1980,1979,1978,1977,1976,1975,1974,1973,1972,1971,1970,1969
This statistics in other country:
AfghanistanAlbaniaAlgeriaAngolaAntigua and BarbudaArab WorldArgentinaArmeniaArubaAustraliaAustriaAzerbaijanBahamas, TheBahrainBangladeshBarbadosBelarusBelgiumBelizeBeninBermudaBhutanBoliviaBosnia and HerzegovinaBotswanaBrazilBrunei DarussalamBulgariaBurkina FasoBurundiCabo VerdeCambodiaCameroonCanadaCaribbean small statesCentral African RepublicCentral Europe and the BalticsChadChileChinaColombiaComorosCongo, Dem. Rep.Congo, Rep.Costa RicaCote d'IvoireCroatiaCuracaoCyprusCzech RepublicDenmarkDjiboutiDominicaDominican RepublicEarly-demographic dividendEast Asia & PacificEast Asia & Pacific (excluding high income)East Asia & Pacific (IDA & IBRD countries)EcuadorEgypt, Arab Rep.El SalvadorEquatorial GuineaEritreaEstoniaEthiopiaEuro areaEurope & Central AsiaEurope & Central Asia (excluding high income)Europe & Central Asia (IDA & IBRD countries)European UnionFaroe IslandsFijiFinlandFragile and conflict affected situationsFranceFrench PolynesiaGabonGambia, TheGeorgiaGermanyGhanaGreeceGrenadaGuatemalaGuineaGuinea-BissauGuyanaHaitiHeavily indebted poor countries (HIPC)High incomeHondurasHong Kong SAR, ChinaHungaryIBRD onlyIcelandIDA & IBRD totalIDA blendIDA onlyIDA totalIndiaIndonesiaIran, Islamic Rep.IraqIrelandIsraelItalyJamaicaJapanJordanKazakhstanKenyaKiribatiKorea, Rep.KosovoKuwaitKyrgyz RepublicLao PDRLate-demographic dividendLatin America & Caribbean Latin America & Caribbean (excluding high income)Latin America & the Caribbean (IDA & IBRD countries)LatviaLeast developed countries: UN classificationLebanonLesothoLiberiaLibyaLithuaniaLow & middle incomeLow incomeLower middle incomeLuxembourgMacao SAR, ChinaMacedonia, FYRMadagascarMalawiMalaysiaMaldivesMaliMaltaMarshall IslandsMauritaniaMauritiusMexicoMicronesia, Fed. Sts.Middle East & North Africa (excluding high income)Middle East & North Africa (IDA & IBRD countries)Middle incomeMoldovaMongoliaMontenegroMoroccoMozambiqueMyanmarNamibiaNepalNetherlandsNew CaledoniaNew ZealandNicaraguaNigerNigeriaNorth AmericaNorwayOECD membersOmanOther small statesPacific island small statesPakistanPalauPanamaPapua New GuineaParaguayPeruPhilippinesPolandPortugalPost-demographic dividendPre-demographic dividendQatarRomaniaRussian FederationRwandaSamoaSao Tome and PrincipeSaudi ArabiaSenegalSerbiaSeychellesSierra LeoneSingaporeSint Maarten (Dutch part)Slovak RepublicSloveniaSmall statesSolomon IslandsSouth AfricaSouth AsiaSouth Asia (IDA & IBRD)South SudanSpainSri LankaSt. Kitts and NevisSt. LuciaSt. Vincent and the GrenadinesSub-Saharan Africa Sub-Saharan Africa (excluding high income)Sub-Saharan Africa (IDA & IBRD countries)SudanSurinameSwazilandSwedenSwitzerlandSyrian Arab RepublicTajikistanTanzaniaThailandTimor-LesteTogoTongaTrinidad and TobagoTunisiaTurkeyTuvaluUgandaUkraineUnited KingdomUnited StatesUpper middle incomeUruguayVanuatuVenezuela, RBVietnamWest Bank and GazaWorldYemen, Rep.ZambiaZimbabwe Timeline:
This timeline shows a graph from 1969 to 2016 of Dominican Republic. No data until 1968. Number of actual observations by date: 48.
Source name:
World Development Indicators
Source organization:
International Monetary Fund, Balance of Payments Statistics Yearbook and data files.
Categories, topics:
Economy & Growth, Trade
Last updated:
apr 23, 2017
Indicators value changes by year
Minimum:
68.9 mln
jan 1, 1969
Maximum:
3.287 bln
jan 1, 2011
At the date of observation
Value
Absolute change
Change from previous value
jan 1, 1969
68.9 mln
+68.9 mln
0.0%
jan 1, 1970
79.5 mln
+10.6 mln
15.38%
jan 1, 1971
86.2 mln
+6.7 mln
8.43%
jan 1, 1972
98.5 mln
+12.3 mln
14.27%
jan 1, 1973
104.1 mln
+5.6 mln
5.69%
jan 1, 1974
142.0 mln
+37.9 mln
36.41%
jan 1, 1975
243.4 mln
+101.4 mln
71.41%
jan 1, 1976
236.3 mln
-7.1 mln
-2.92%
jan 1, 1977
226.4 mln
-9.9 mln
-4.19%
jan 1, 1978
247.7 mln
+21.3 mln
9.41%
jan 1, 1979
291.6 mln
+43.9 mln
17.72%
jan 1, 1980
346.8 mln
+55.2 mln
18.93%
jan 1, 1981
399.0 mln
+52.2 mln
15.05%
jan 1, 1982
366.7 mln
-32.3 mln
-8.1%
jan 1, 1983
277.3 mln
-89.4 mln
-24.38%
jan 1, 1984
298.6 mln
+21.3 mln
7.68%
jan 1, 1985
299.5 mln
+900.0K
0.3%
jan 1, 1986
274.5 mln
-25.0 mln
-8.35%
jan 1, 1987
283.1 mln
+8.6 mln
3.13%
jan 1, 1988
360.4 mln
+77.3 mln
27.3%
jan 1, 1989
397.0 mln
+36.6 mln
10.16%
jan 1, 1990
464.7 mln
+67.7 mln
17.05%
jan 1, 1991
440.4 mln
-24.3 mln
-5.23%
jan 1, 1992
479.3 mln
+38.9 mln
8.83%
jan 1, 1993
555.1 mln
+75.8 mln
15.81%
jan 1, 1994
823.8 mln
+268.7 mln
48.41%
jan 1, 1995
921.1 mln
+97.3 mln
11.81%
jan 1, 1996
966.4 mln
+45.3 mln
4.92%
jan 1, 1997
1.121 bln
+155.0 mln
16.04%
jan 1, 1998
1.171 bln
+49.9 mln
4.45%
jan 1, 1999
1.319 bln
+148.2 mln
12.65%
jan 1, 2000
1.248 bln
-71.5 mln
-5.42%
jan 1, 2001
1.373 bln
+125.3 mln
10.04%
jan 1, 2002
1.284 bln
-89.4 mln
-6.51%
jan 1, 2003
1.313 bln
+29.6 mln
2.31%
jan 1, 2004
1.219 bln
-94.1 mln
-7.16%
jan 1, 2005
1.213 bln
-6.23 mln
-0.51%
jan 1, 2006
1.478 bln
+265.03 mln
21.85%
jan 1, 2007
1.582 bln
+103.81 mln
7.02%
jan 1, 2008
1.772 bln
+190.39 mln
12.03%
jan 1, 2009
1.989 bln
+217.0 mln
12.24%
jan 1, 2010
1.857 bln
-132.4 mln
-6.66%
jan 1, 2011
3.287 bln
+1.43 bln
77.0%
jan 1, 2012
2.899 bln
-387.8 mln
-11.8%
jan 1, 2013
2.938 bln
+39.5 mln
1.36%
jan 1, 2014
2.761 bln
-177.3 mln
-6.03%
jan 1, 2015
2.835 bln
+73.9 mln
2.68%
jan 1, 2016
3.139 bln
+303.9 mln
10.72%
Ranking of countries by current statistics by years


Comments: