29
/
en
AIzaSyAYiBZKx7MnpbEhh9jyipgxe19OcubqV5w
April 1, 2024
190919
Mali
MLI
true
2
1
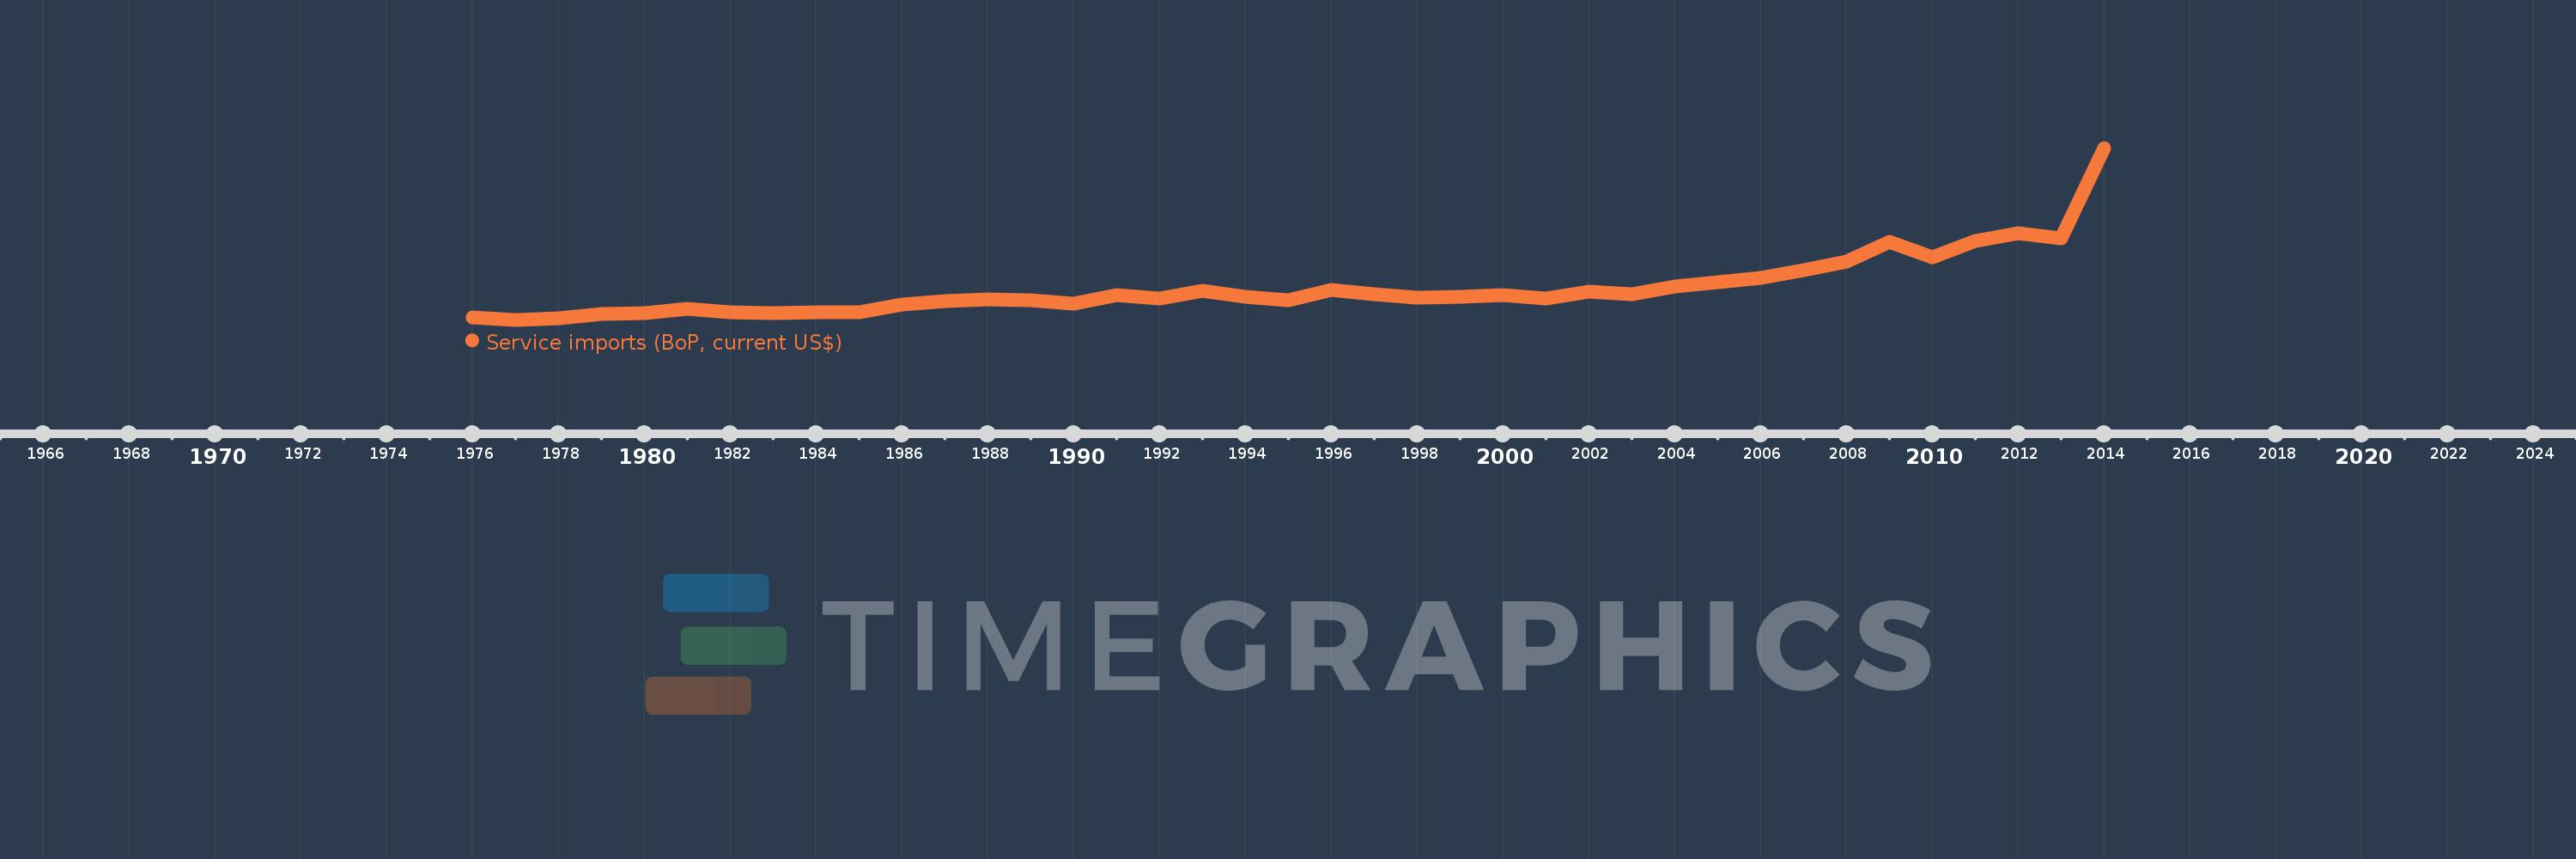
Service imports (BoP, current US$)
2014,2013,2012,2011,2010,2009,2008,2007,2006,2005,2004,2003,2002,2001,2000,1999,1998,1997,1996,1995,1994,1993,1992,1991,1990,1989,1988,1987,1986,1985,1984,1983,1982,1981,1980,1979,1978,1977,1976
This statistics in other country:
AfghanistanAlbaniaAlgeriaAngolaAntigua and BarbudaArab WorldArgentinaArmeniaArubaAustraliaAustriaAzerbaijanBahamas, TheBahrainBangladeshBarbadosBelarusBelgiumBelizeBeninBermudaBhutanBoliviaBosnia and HerzegovinaBotswanaBrazilBrunei DarussalamBulgariaBurkina FasoBurundiCabo VerdeCambodiaCameroonCanadaCaribbean small statesCentral African RepublicCentral Europe and the BalticsChadChileChinaColombiaComorosCongo, Dem. Rep.Congo, Rep.Costa RicaCote d'IvoireCroatiaCuracaoCyprusCzech RepublicDenmarkDjiboutiDominicaDominican RepublicEarly-demographic dividendEast Asia & PacificEast Asia & Pacific (excluding high income)East Asia & Pacific (IDA & IBRD countries)EcuadorEgypt, Arab Rep.El SalvadorEquatorial GuineaEritreaEstoniaEthiopiaEuro areaEurope & Central AsiaEurope & Central Asia (excluding high income)Europe & Central Asia (IDA & IBRD countries)European UnionFaroe IslandsFijiFinlandFragile and conflict affected situationsFranceFrench PolynesiaGabonGambia, TheGeorgiaGermanyGhanaGreeceGrenadaGuatemalaGuineaGuinea-BissauGuyanaHaitiHeavily indebted poor countries (HIPC)High incomeHondurasHong Kong SAR, ChinaHungaryIBRD onlyIcelandIDA & IBRD totalIDA blendIDA onlyIDA totalIndiaIndonesiaIran, Islamic Rep.IraqIrelandIsraelItalyJamaicaJapanJordanKazakhstanKenyaKiribatiKorea, Rep.KosovoKuwaitKyrgyz RepublicLao PDRLate-demographic dividendLatin America & Caribbean Latin America & Caribbean (excluding high income)Latin America & the Caribbean (IDA & IBRD countries)LatviaLeast developed countries: UN classificationLebanonLesothoLiberiaLibyaLithuaniaLow & middle incomeLow incomeLower middle incomeLuxembourgMacao SAR, ChinaMacedonia, FYRMadagascarMalawiMalaysiaMaldivesMaliMaltaMarshall IslandsMauritaniaMauritiusMexicoMicronesia, Fed. Sts.Middle East & North Africa (excluding high income)Middle East & North Africa (IDA & IBRD countries)Middle incomeMoldovaMongoliaMontenegroMoroccoMozambiqueMyanmarNamibiaNepalNetherlandsNew CaledoniaNew ZealandNicaraguaNigerNigeriaNorth AmericaNorwayOECD membersOmanOther small statesPacific island small statesPakistanPalauPanamaPapua New GuineaParaguayPeruPhilippinesPolandPortugalPost-demographic dividendPre-demographic dividendQatarRomaniaRussian FederationRwandaSamoaSao Tome and PrincipeSaudi ArabiaSenegalSerbiaSeychellesSierra LeoneSingaporeSint Maarten (Dutch part)Slovak RepublicSloveniaSmall statesSolomon IslandsSouth AfricaSouth AsiaSouth Asia (IDA & IBRD)South SudanSpainSri LankaSt. Kitts and NevisSt. LuciaSt. Vincent and the GrenadinesSub-Saharan Africa Sub-Saharan Africa (excluding high income)Sub-Saharan Africa (IDA & IBRD countries)SudanSurinameSwazilandSwedenSwitzerlandSyrian Arab RepublicTajikistanTanzaniaThailandTimor-LesteTogoTongaTrinidad and TobagoTunisiaTurkeyTuvaluUgandaUkraineUnited KingdomUnited StatesUpper middle incomeUruguayVanuatuVenezuela, RBVietnamWest Bank and GazaWorldYemen, Rep.ZambiaZimbabwe Timeline:
This timeline shows a graph from 1976 to 2014 of Mali. No data until 1975. Number of actual observations by date: 39.
Source name:
World Development Indicators
Source organization:
International Monetary Fund, Balance of Payments Statistics Yearbook and data files.
Categories, topics:
Economy & Growth, Trade
Last updated:
apr 23, 2017
Indicators value changes by year
Minimum:
78.74 mln
jan 1, 1977
Maximum:
2.157 bln
jan 1, 2014
At the date of observation
Value
Absolute change
Change from previous value
jan 1, 1976
102.467 mln
+102.467 mln
0.0%
jan 1, 1977
78.74 mln
-23.727 mln
-23.16%
jan 1, 1978
95.449 mln
+16.709 mln
21.22%
jan 1, 1979
150.672 mln
+55.222 mln
57.86%
jan 1, 1980
163.829 mln
+13.157 mln
8.73%
jan 1, 1981
211.805 mln
+47.976 mln
29.28%
jan 1, 1982
168.917 mln
-42.888 mln
-20.25%
jan 1, 1983
162.657 mln
-6.26 mln
-3.71%
jan 1, 1984
166.9 mln
+4.244 mln
2.61%
jan 1, 1985
172.946 mln
+6.046 mln
3.62%
jan 1, 1986
263.721 mln
+90.775 mln
52.49%
jan 1, 1987
306.694 mln
+42.973 mln
16.3%
jan 1, 1988
327.082 mln
+20.388 mln
6.65%
jan 1, 1989
312.24 mln
-14.842 mln
-4.54%
jan 1, 1990
270.683 mln
-41.557 mln
-13.31%
jan 1, 1991
374.121 mln
+103.438 mln
38.21%
jan 1, 1992
334.554 mln
-39.567 mln
-10.58%
jan 1, 1993
428.574 mln
+94.02 mln
28.1%
jan 1, 1994
360.817 mln
-67.756 mln
-15.81%
jan 1, 1995
317.018 mln
-43.799 mln
-12.14%
jan 1, 1996
434.54 mln
+117.522 mln
37.07%
jan 1, 1997
383.402 mln
-51.139 mln
-11.77%
jan 1, 1998
350.018 mln
-33.383 mln
-8.71%
jan 1, 1999
353.315 mln
+3.297 mln
0.94%
jan 1, 2000
377.144 mln
+23.828 mln
6.74%
jan 1, 2001
334.771 mln
-42.373 mln
-11.24%
jan 1, 2002
422.629 mln
+87.858 mln
26.24%
jan 1, 2003
392.576 mln
-30.052 mln
-7.11%
jan 1, 2004
485.313 mln
+92.737 mln
23.62%
jan 1, 2005
533.835 mln
+48.522 mln
10.0%
jan 1, 2006
589.95 mln
+56.115 mln
10.51%
jan 1, 2007
676.605 mln
+86.655 mln
14.69%
jan 1, 2008
778.105 mln
+101.5 mln
15.0%
jan 1, 2009
1.027 bln
+248.479 mln
31.93%
jan 1, 2010
829.588 mln
-196.997 mln
-19.19%
jan 1, 2011
1.028 bln
+197.999 mln
23.87%
jan 1, 2012
1.128 bln
+100.77 mln
9.81%
jan 1, 2013
1.064 bln
-64.094 mln
-5.68%
jan 1, 2014
2.157 bln
+1.093 bln
102.72%
Ranking of countries by current statistics by years


Comments: