29
/
en
AIzaSyAYiBZKx7MnpbEhh9jyipgxe19OcubqV5w
April 1, 2024
172211
Kuwait
KWT
true
2
1
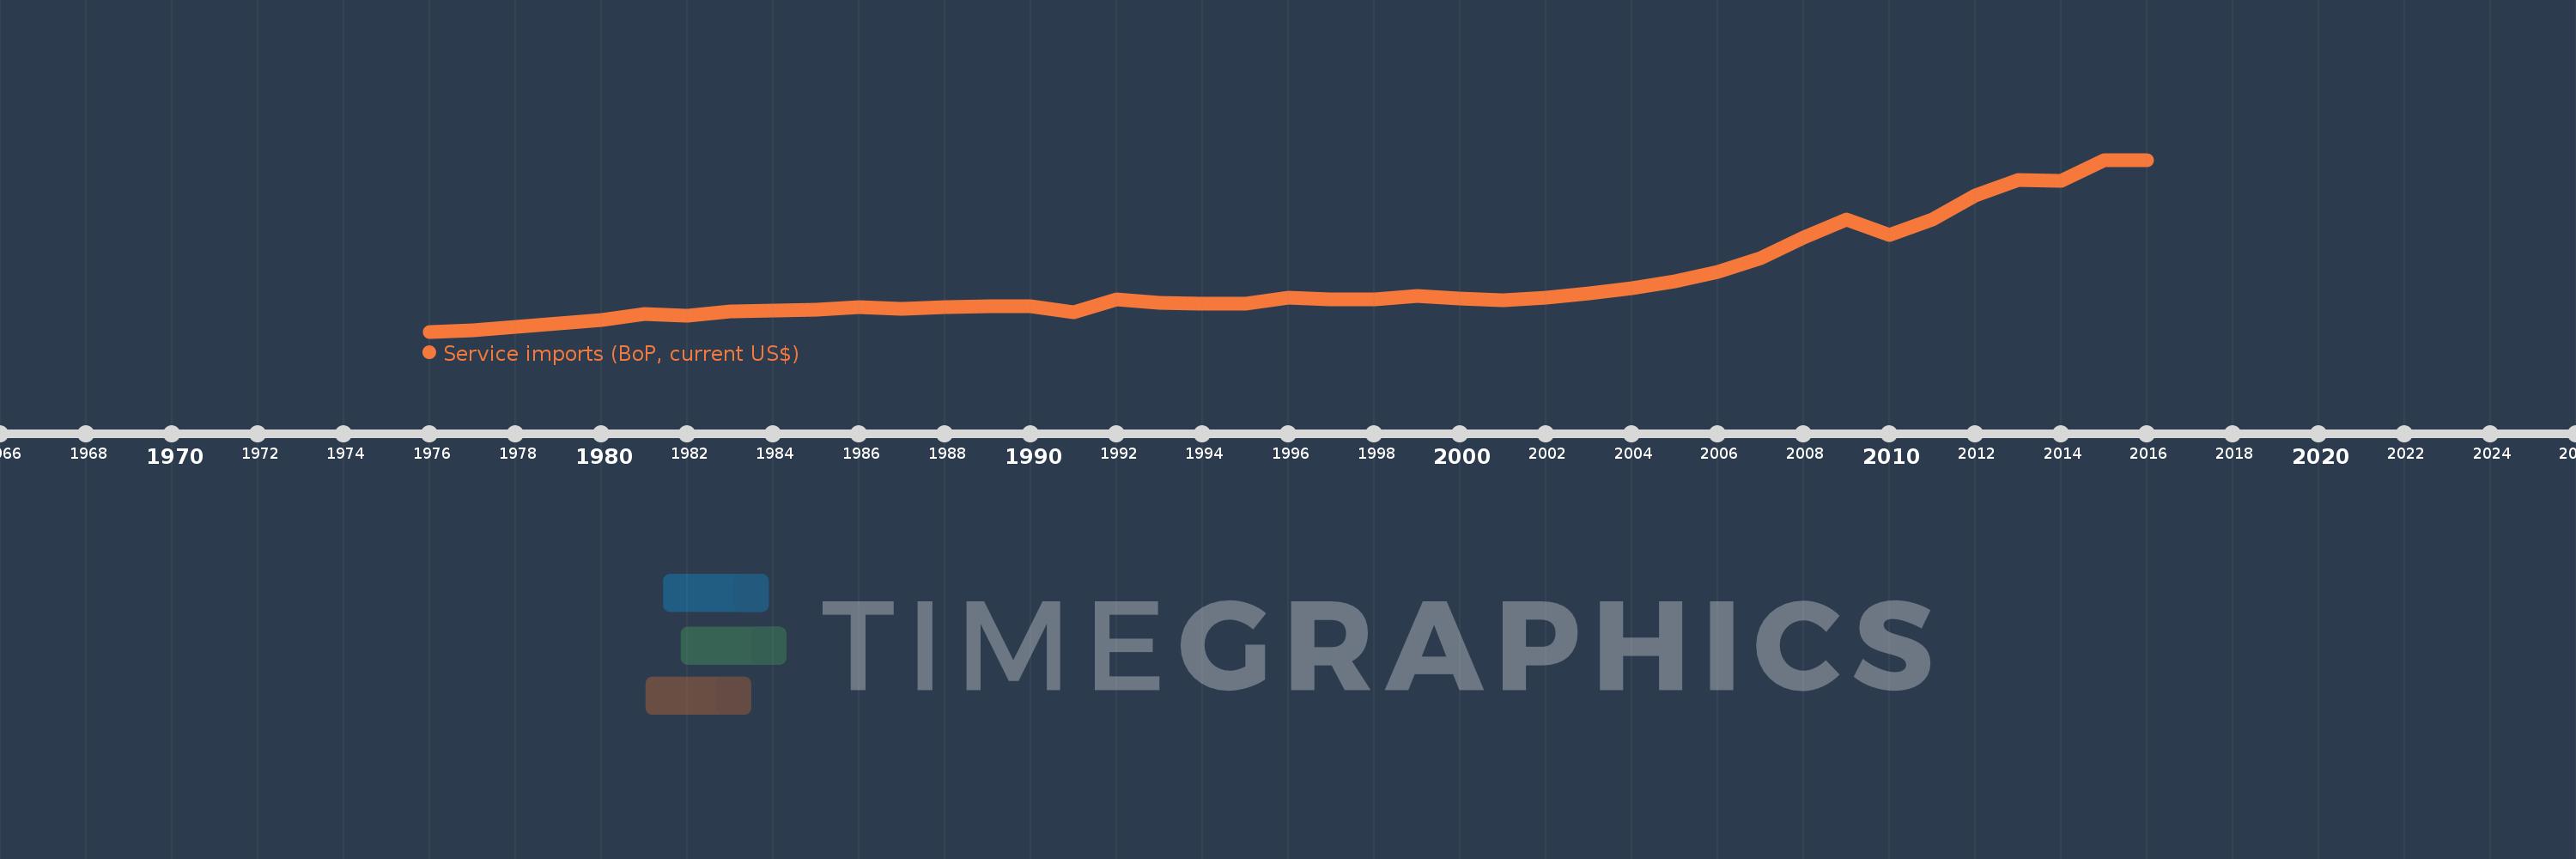
Service imports (BoP, current US$)
2016,2015,2014,2013,2012,2011,2010,2009,2008,2007,2006,2005,2004,2003,2002,2001,2000,1999,1998,1997,1996,1995,1994,1993,1992,1991,1990,1989,1988,1987,1986,1985,1984,1983,1982,1981,1980,1979,1978,1977,1976
This statistics in other country:
AfghanistanAlbaniaAlgeriaAngolaAntigua and BarbudaArab WorldArgentinaArmeniaArubaAustraliaAustriaAzerbaijanBahamas, TheBahrainBangladeshBarbadosBelarusBelgiumBelizeBeninBermudaBhutanBoliviaBosnia and HerzegovinaBotswanaBrazilBrunei DarussalamBulgariaBurkina FasoBurundiCabo VerdeCambodiaCameroonCanadaCaribbean small statesCentral African RepublicCentral Europe and the BalticsChadChileChinaColombiaComorosCongo, Dem. Rep.Congo, Rep.Costa RicaCote d'IvoireCroatiaCuracaoCyprusCzech RepublicDenmarkDjiboutiDominicaDominican RepublicEarly-demographic dividendEast Asia & PacificEast Asia & Pacific (excluding high income)East Asia & Pacific (IDA & IBRD countries)EcuadorEgypt, Arab Rep.El SalvadorEquatorial GuineaEritreaEstoniaEthiopiaEuro areaEurope & Central AsiaEurope & Central Asia (excluding high income)Europe & Central Asia (IDA & IBRD countries)European UnionFaroe IslandsFijiFinlandFragile and conflict affected situationsFranceFrench PolynesiaGabonGambia, TheGeorgiaGermanyGhanaGreeceGrenadaGuatemalaGuineaGuinea-BissauGuyanaHaitiHeavily indebted poor countries (HIPC)High incomeHondurasHong Kong SAR, ChinaHungaryIBRD onlyIcelandIDA & IBRD totalIDA blendIDA onlyIDA totalIndiaIndonesiaIran, Islamic Rep.IraqIrelandIsraelItalyJamaicaJapanJordanKazakhstanKenyaKiribatiKorea, Rep.KosovoKuwaitKyrgyz RepublicLao PDRLate-demographic dividendLatin America & Caribbean Latin America & Caribbean (excluding high income)Latin America & the Caribbean (IDA & IBRD countries)LatviaLeast developed countries: UN classificationLebanonLesothoLiberiaLibyaLithuaniaLow & middle incomeLow incomeLower middle incomeLuxembourgMacao SAR, ChinaMacedonia, FYRMadagascarMalawiMalaysiaMaldivesMaliMaltaMarshall IslandsMauritaniaMauritiusMexicoMicronesia, Fed. Sts.Middle East & North Africa (excluding high income)Middle East & North Africa (IDA & IBRD countries)Middle incomeMoldovaMongoliaMontenegroMoroccoMozambiqueMyanmarNamibiaNepalNetherlandsNew CaledoniaNew ZealandNicaraguaNigerNigeriaNorth AmericaNorwayOECD membersOmanOther small statesPacific island small statesPakistanPalauPanamaPapua New GuineaParaguayPeruPhilippinesPolandPortugalPost-demographic dividendPre-demographic dividendQatarRomaniaRussian FederationRwandaSamoaSao Tome and PrincipeSaudi ArabiaSenegalSerbiaSeychellesSierra LeoneSingaporeSint Maarten (Dutch part)Slovak RepublicSloveniaSmall statesSolomon IslandsSouth AfricaSouth AsiaSouth Asia (IDA & IBRD)South SudanSpainSri LankaSt. Kitts and NevisSt. LuciaSt. Vincent and the GrenadinesSub-Saharan Africa Sub-Saharan Africa (excluding high income)Sub-Saharan Africa (IDA & IBRD countries)SudanSurinameSwazilandSwedenSwitzerlandSyrian Arab RepublicTajikistanTanzaniaThailandTimor-LesteTogoTongaTrinidad and TobagoTunisiaTurkeyTuvaluUgandaUkraineUnited KingdomUnited StatesUpper middle incomeUruguayVanuatuVenezuela, RBVietnamWest Bank and GazaWorldYemen, Rep.ZambiaZimbabwe Timeline:
This timeline shows a graph from 1976 to 2016 of Kuwait. No data until 1975. Number of actual observations by date: 41.
Source name:
World Development Indicators
Source organization:
International Monetary Fund, Balance of Payments Statistics Yearbook and data files.
Categories, topics:
Economy & Growth, Trade
Last updated:
apr 23, 2017
Indicators value changes by year
Minimum:
758.536 mln
jan 1, 1976
Maximum:
23.796 bln
jan 1, 2016
At the date of observation
Value
Absolute change
Change from previous value
jan 1, 1976
758.536 mln
+758.536 mln
0.0%
jan 1, 1977
974.734 mln
+216.198 mln
28.5%
jan 1, 1978
1.406 bln
+431.574 mln
44.28%
jan 1, 1979
1.854 bln
+447.882 mln
31.85%
jan 1, 1980
2.265 bln
+410.922 mln
22.16%
jan 1, 1981
3.067 bln
+801.88 mln
35.4%
jan 1, 1982
2.905 bln
-161.531 mln
-5.27%
jan 1, 1983
3.491 bln
+585.201 mln
20.14%
jan 1, 1984
3.62 bln
+128.839 mln
3.69%
jan 1, 1985
3.705 bln
+85.805 mln
2.37%
jan 1, 1986
4.086 bln
+381.1 mln
10.29%
jan 1, 1987
3.861 bln
-225.358 mln
-5.51%
jan 1, 1988
4.077 bln
+215.557 mln
5.58%
jan 1, 1989
4.204 bln
+127.255 mln
3.12%
jan 1, 1990
4.119 bln
-85.124 mln
-2.02%
jan 1, 1991
3.359 bln
-759.46 mln
-18.44%
jan 1, 1992
5.09 bln
+1.731 bln
51.53%
jan 1, 1993
4.59 bln
-499.888 mln
-9.82%
jan 1, 1994
4.539 bln
-51.519 mln
-1.12%
jan 1, 1995
4.5 bln
-38.568 mln
-0.85%
jan 1, 1996
5.36 bln
+860.121 mln
19.11%
jan 1, 1997
5.072 bln
-288.07 mln
-5.37%
jan 1, 1998
5.129 bln
+57.075 mln
1.13%
jan 1, 1999
5.546 bln
+416.675 mln
8.12%
jan 1, 2000
5.172 bln
-374.519 mln
-6.75%
jan 1, 2001
4.921 bln
-250.644 mln
-4.85%
jan 1, 2002
5.355 bln
+433.818 mln
8.82%
jan 1, 2003
5.838 bln
+483.751 mln
9.03%
jan 1, 2004
6.615 bln
+776.692 mln
13.3%
jan 1, 2005
7.495 bln
+879.899 mln
13.3%
jan 1, 2006
8.715 bln
+1.22 bln
16.27%
jan 1, 2007
10.638 bln
+1.924 bln
22.07%
jan 1, 2008
13.344 bln
+2.705 bln
25.43%
jan 1, 2009
15.777 bln
+2.434 bln
18.24%
jan 1, 2010
13.743 bln
-2.035 bln
-12.9%
jan 1, 2011
15.785 bln
+2.042 bln
14.86%
jan 1, 2012
19.013 bln
+3.228 bln
20.45%
jan 1, 2013
21.097 bln
+2.084 bln
10.96%
jan 1, 2014
21.004 bln
-93.184 mln
-0.44%
jan 1, 2015
23.787 bln
+2.783 bln
13.25%
jan 1, 2016
23.796 bln
+9.451 mln
0.04%
Ranking of countries by current statistics by years


Comments: