29
/
en
AIzaSyAYiBZKx7MnpbEhh9jyipgxe19OcubqV5w
April 1, 2024
131169
Ethiopia
ETH
true
2
1
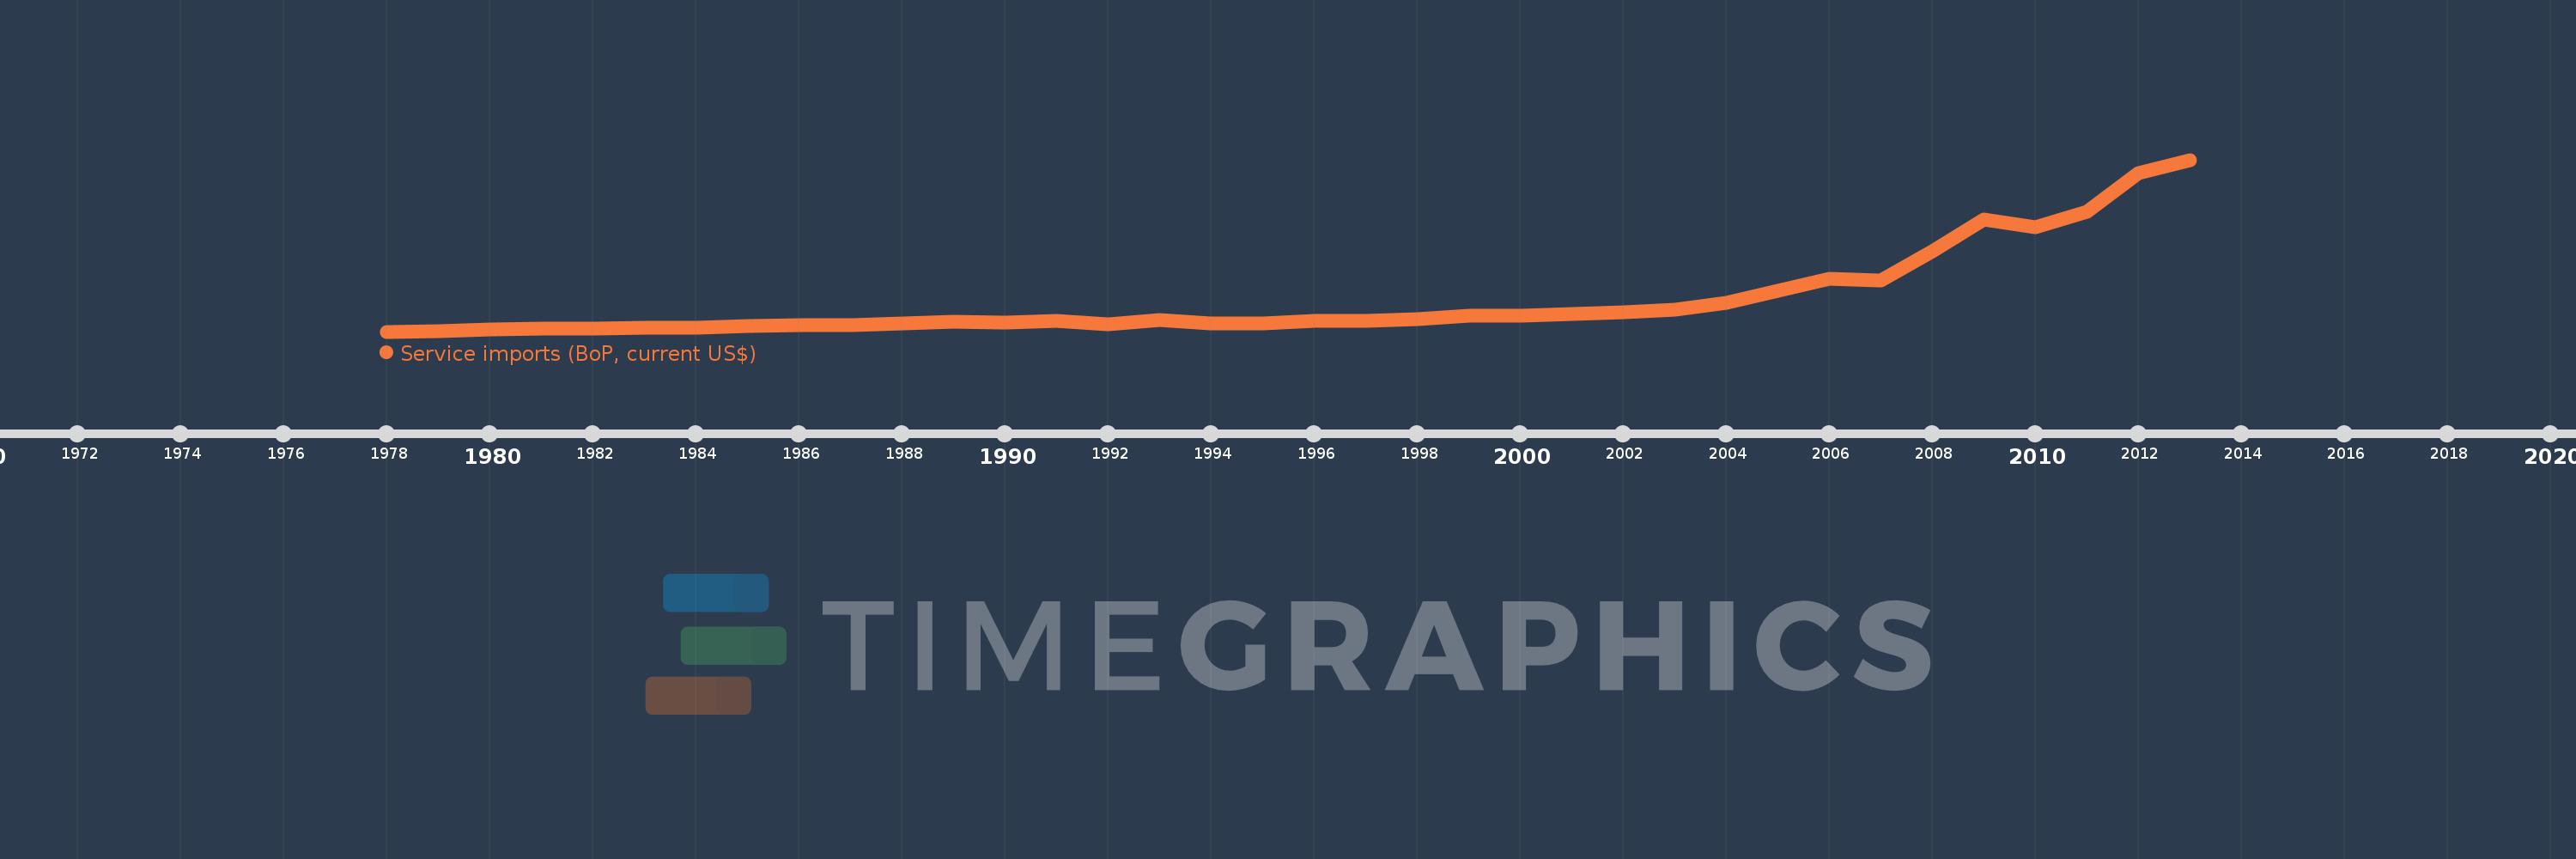
Service imports (BoP, current US$)
2013,2012,2011,2010,2009,2008,2007,2006,2005,2004,2003,2002,2001,2000,1999,1998,1997,1996,1995,1994,1993,1992,1991,1990,1989,1988,1987,1986,1985,1984,1983,1982,1981,1980,1979,1978
This statistics in other country:
AfghanistanAlbaniaAlgeriaAngolaAntigua and BarbudaArab WorldArgentinaArmeniaArubaAustraliaAustriaAzerbaijanBahamas, TheBahrainBangladeshBarbadosBelarusBelgiumBelizeBeninBermudaBhutanBoliviaBosnia and HerzegovinaBotswanaBrazilBrunei DarussalamBulgariaBurkina FasoBurundiCabo VerdeCambodiaCameroonCanadaCaribbean small statesCentral African RepublicCentral Europe and the BalticsChadChileChinaColombiaComorosCongo, Dem. Rep.Congo, Rep.Costa RicaCote d'IvoireCroatiaCuracaoCyprusCzech RepublicDenmarkDjiboutiDominicaDominican RepublicEarly-demographic dividendEast Asia & PacificEast Asia & Pacific (excluding high income)East Asia & Pacific (IDA & IBRD countries)EcuadorEgypt, Arab Rep.El SalvadorEquatorial GuineaEritreaEstoniaEthiopiaEuro areaEurope & Central AsiaEurope & Central Asia (excluding high income)Europe & Central Asia (IDA & IBRD countries)European UnionFaroe IslandsFijiFinlandFragile and conflict affected situationsFranceFrench PolynesiaGabonGambia, TheGeorgiaGermanyGhanaGreeceGrenadaGuatemalaGuineaGuinea-BissauGuyanaHaitiHeavily indebted poor countries (HIPC)High incomeHondurasHong Kong SAR, ChinaHungaryIBRD onlyIcelandIDA & IBRD totalIDA blendIDA onlyIDA totalIndiaIndonesiaIran, Islamic Rep.IraqIrelandIsraelItalyJamaicaJapanJordanKazakhstanKenyaKiribatiKorea, Rep.KosovoKuwaitKyrgyz RepublicLao PDRLate-demographic dividendLatin America & Caribbean Latin America & Caribbean (excluding high income)Latin America & the Caribbean (IDA & IBRD countries)LatviaLeast developed countries: UN classificationLebanonLesothoLiberiaLibyaLithuaniaLow & middle incomeLow incomeLower middle incomeLuxembourgMacao SAR, ChinaMacedonia, FYRMadagascarMalawiMalaysiaMaldivesMaliMaltaMarshall IslandsMauritaniaMauritiusMexicoMicronesia, Fed. Sts.Middle East & North Africa (excluding high income)Middle East & North Africa (IDA & IBRD countries)Middle incomeMoldovaMongoliaMontenegroMoroccoMozambiqueMyanmarNamibiaNepalNetherlandsNew CaledoniaNew ZealandNicaraguaNigerNigeriaNorth AmericaNorwayOECD membersOmanOther small statesPacific island small statesPakistanPalauPanamaPapua New GuineaParaguayPeruPhilippinesPolandPortugalPost-demographic dividendPre-demographic dividendQatarRomaniaRussian FederationRwandaSamoaSao Tome and PrincipeSaudi ArabiaSenegalSerbiaSeychellesSierra LeoneSingaporeSint Maarten (Dutch part)Slovak RepublicSloveniaSmall statesSolomon IslandsSouth AfricaSouth AsiaSouth Asia (IDA & IBRD)South SudanSpainSri LankaSt. Kitts and NevisSt. LuciaSt. Vincent and the GrenadinesSub-Saharan Africa Sub-Saharan Africa (excluding high income)Sub-Saharan Africa (IDA & IBRD countries)SudanSurinameSwazilandSwedenSwitzerlandSyrian Arab RepublicTajikistanTanzaniaThailandTimor-LesteTogoTongaTrinidad and TobagoTunisiaTurkeyTuvaluUgandaUkraineUnited KingdomUnited StatesUpper middle incomeUruguayVanuatuVenezuela, RBVietnamWest Bank and GazaWorldYemen, Rep.ZambiaZimbabwe Timeline:
This timeline shows a graph from 1978 to 2013 of Ethiopia. No data until 1977. Number of actual observations by date: 36.
Source name:
World Development Indicators
Source organization:
International Monetary Fund, Balance of Payments Statistics Yearbook and data files.
Categories, topics:
Economy & Growth, Trade
Last updated:
apr 23, 2017
Indicators value changes by year
Minimum:
139.469 mln
jan 1, 1978
Maximum:
3.583 bln
jan 1, 2013
At the date of observation
Value
Absolute change
Change from previous value
jan 1, 1978
139.469 mln
+139.469 mln
0.0%
jan 1, 1979
151.111 mln
+11.643 mln
8.35%
jan 1, 1980
175.266 mln
+24.155 mln
15.98%
jan 1, 1981
208.261 mln
+32.995 mln
18.83%
jan 1, 1982
206.57 mln
-1.691 mln
-0.81%
jan 1, 1983
212.367 mln
+5.797 mln
2.81%
jan 1, 1984
224.831 mln
+12.464 mln
5.87%
jan 1, 1985
252.609 mln
+27.778 mln
12.35%
jan 1, 1986
270.773 mln
+18.164 mln
7.19%
jan 1, 1987
271.739 mln
+966.184K
0.36%
jan 1, 1988
307.681 mln
+35.942 mln
13.23%
jan 1, 1989
330.097 mln
+22.415 mln
7.29%
jan 1, 1990
323.382 mln
-6.715 mln
-2.03%
jan 1, 1991
358.841 mln
+35.459 mln
10.97%
jan 1, 1992
284.348 mln
-74.493 mln
-20.76%
jan 1, 1993
368.26 mln
+83.912 mln
29.51%
jan 1, 1994
299.02 mln
-69.24 mln
-18.8%
jan 1, 1995
310.412 mln
+11.392 mln
3.81%
jan 1, 1996
352.843 mln
+42.431 mln
13.67%
jan 1, 1997
349.755 mln
-3.088 mln
-0.88%
jan 1, 1998
394.228 mln
+44.472 mln
12.72%
jan 1, 1999
455.558 mln
+61.33 mln
15.56%
jan 1, 2000
466.316 mln
+10.758 mln
2.36%
jan 1, 2001
489.601 mln
+23.285 mln
4.99%
jan 1, 2002
521.523 mln
+31.922 mln
6.52%
jan 1, 2003
578.742 mln
+57.219 mln
10.97%
jan 1, 2004
708.672 mln
+129.93 mln
22.45%
jan 1, 2005
958.289 mln
+249.618 mln
35.22%
jan 1, 2006
1.194 bln
+235.541 mln
24.58%
jan 1, 2007
1.171 bln
-23.277 mln
-1.95%
jan 1, 2008
1.749 bln
+578.328 mln
49.41%
jan 1, 2009
2.392 bln
+642.717 mln
36.75%
jan 1, 2010
2.224 bln
-167.802 mln
-7.02%
jan 1, 2011
2.546 bln
+322.458 mln
14.5%
jan 1, 2012
3.322 bln
+775.55 mln
30.46%
jan 1, 2013
3.583 bln
+260.843 mln
7.85%
Ranking of countries by current statistics by years


Comments: